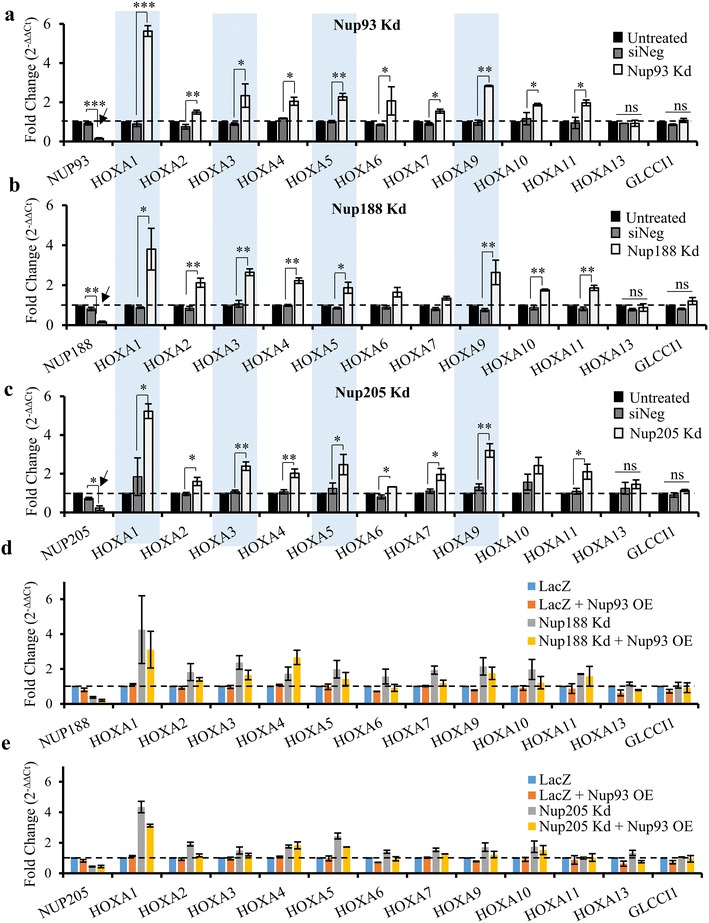
Fig. 3.

Depletion of Nup93, Nup188 and Nup205 derepresses HOXA gene cluster. a–c qRT-PCR analyses was used to determine mRNA levels of all HOXA genes (HOXA1 to HOXA13) upon (a) Nup93, (b) Nup188 and (c) Nup205 knockdowns in DLD1 cells. Graph represents fold change () in levels of mRNA normalized to untreated cells. Error bars: SEM, data from three independent biological replicates that include total of nine technical replicates, *p < 0.05; **p < 0.01; ***p < 0.001 (Students t test between siNeg and knockdown). GLCCI, served as a negative control. d ,e qRT-PCR analyses was used to determine mRNA levels of all HOXA genes (HOXA1 to HOXA13) upon Nup93 overexpression in (d) Nup188- and (e) Nup205-depleted cells. Graph represents fold change () in levels of mRNA normalized to untreated cells. Error bars: SEM, data from two independent biological replicates that include total of six technical replicates. GLCCI, served as a negative control
