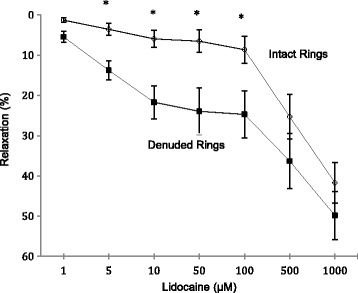
Fig. 2.

Concentration response curves to lidocaine in intact and denuded isolated rat aortic rings. Relaxation is expressed as percent of maximal relaxation to 100 μM papaverine. Points represent mean ± S.E.M of aortic rings. *P < 0.05 statistical difference in responses between the intact and denuded rings. Lidocaine concentrations are on a log scale. Total animals n = 12
