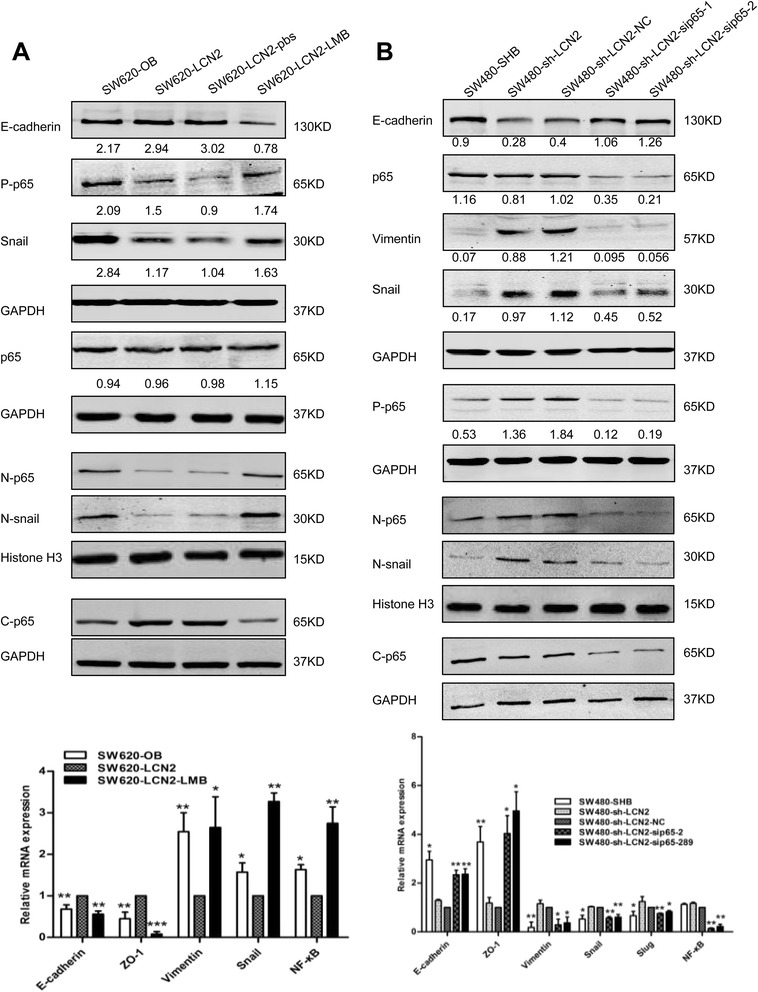
Fig. 6.

EMT changes depend on the LCN2/NF-κB/Snail pathway. a, b Changes of EMT markers measured by western blots and real-time PCR after enhancing NF-ĸB activity with LMB (40nM for 6 h), and quantification of relative mRNA expression of EMT markers in SW620-LCN2 cells (a) and suppressing NF-κB activity with specific siRNA (50nM for 48 h), and quantification of relative mRNA expression of EMT markers in SW480-sh-LCN2 cells (b), The grey value ratios of the corresponding proteins/GAPDH were shown. Values shown in real-time PCR assay are the mean ± SD from at least three independent experiments. (N, nuclear; C, cytoplasm; P, phosphorylated; NC, negative control). * P < .05, ** P < .01, *** P < .001
