
Fig. 3.
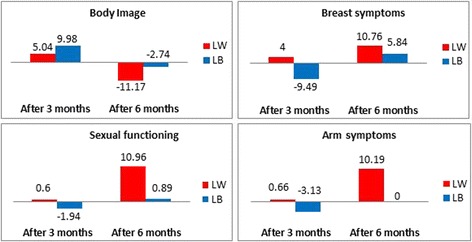
Bar charts representing the change of RS effect in the both cases: deterioration (little worse) and improvement (little better) for some dimensions of QLQ-BR23 questionnaire between three and six months
Official websites use .gov
A
.gov website belongs to an official
government organization in the United States.
Secure .gov websites use HTTPS
A lock (
) or https:// means you've safely
connected to the .gov website. Share sensitive
information only on official, secure websites.
Bar charts representing the change of RS effect in the both cases: deterioration (little worse) and improvement (little better) for some dimensions of QLQ-BR23 questionnaire between three and six months