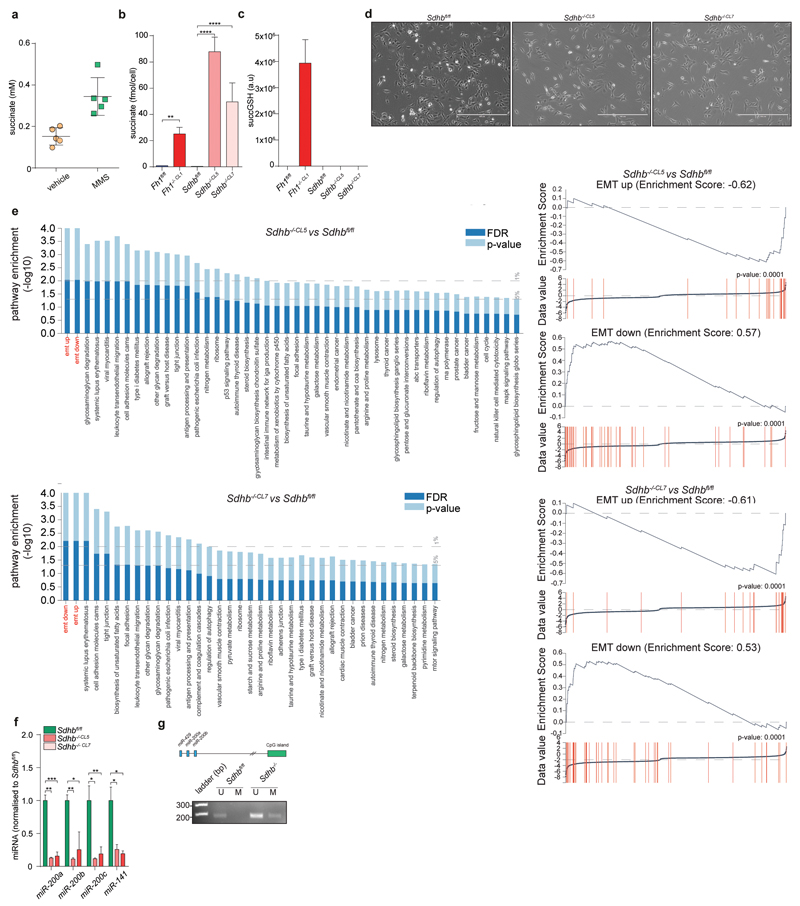
Extended Data Fig. 9. Succinate triggers EMT in Sdhb-deficient cells.
a, Intracellular succinate levels after incubation with 4 mM MMS measured by LCMS. Data are presented as average ±S.D.. b, c, Intracellular succinate (b) and succGSH (c) levels in Sdhb-deficient cells measured by LMCS. Data are presented as average ±S.D.. d, Bright field images of cells of the indicated genotype. Bar = 400 µm. e, Gene set enrichment analysis and EMT enrichment score from expression analysis of the indicated cell lines. f, g, miRNA expression levels normalised to Snord61 and Snord95 as endogenous control (f) and CpG43 methylation (g). Experiments were performed as in Fig. 2b and 2d, respectively. *P ≤0.05, **P ≤0.01, ***P ≤0.001, ****P≤0.0001. Gel sources are presented in Supplementary Figure 1. Raw data are presented in SI Table 2.

