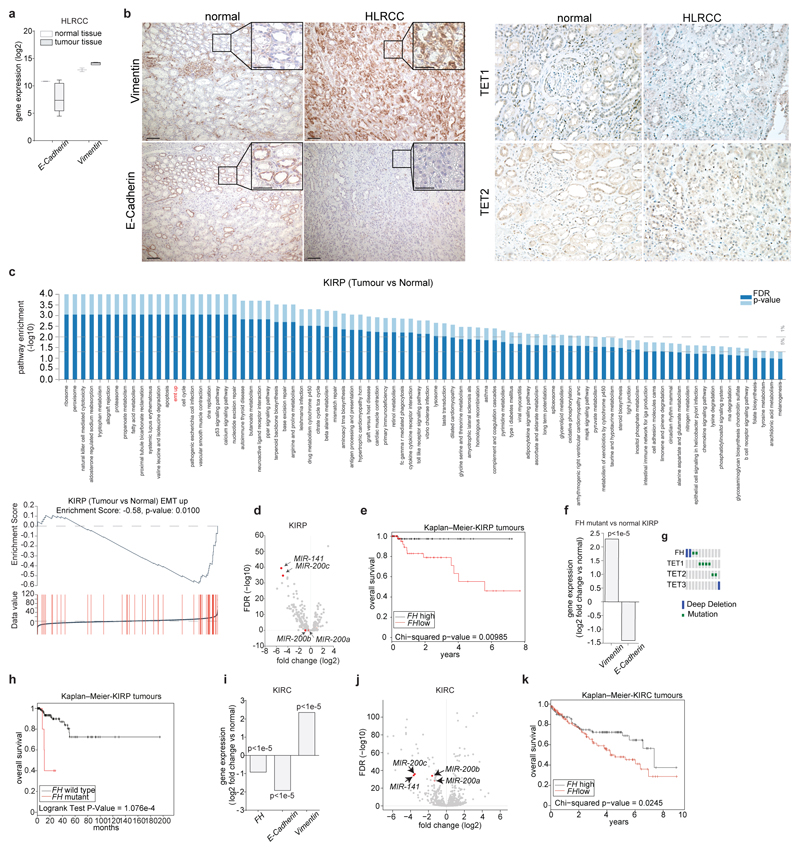
Extended Data Fig. 10. Expression of FH and EMT markers in kidney cancer.
a, Expression levels of Vimentin and E-Cadherin in HLRCC patients obtained from Ooi et al25. b, Immunohistochemistry staining of Vimentin and E-Cadherin (left), and TET1 and TET2 (right) in HLRCC patients obtained as in Fig. 4a. Bar = 100 µm. The insert in the left panel indicate a 3X digital magnification, Bar = 50 µm. c, Gene set enrichment analysis and EMT enrichment score from RNA-seq data of papillary renal cell carcinoma (KIRP) obtained by Linehan et al26. d, Volcano plot of MIRNA expression in KIRP. e, Kaplan-Meier curve of KIRP patients separated according to FH expression. f, Vimentin and E-Cadherin expression in FH-mutant KIRP compared to normal renal tissue. g, Frequency of mutations in FH and TET1, TET2 and TET3 in KIRP analysed using NCBO BioPortal. Only cancers with mutations in the indicated genes are shown. h, Kaplan-Meier curve of FH-wild type and FH-mutant KIRP. i, Expression levels of FH, Vimentin, and E-Cadherin in clear cell renal cell carcinoma (KIRC) obtained from TCGA dataset27. j, Volcano plot of miRNA expression in KIRC. j, Kaplan-Meier curve of KIRC patients separated according to FH expression.

