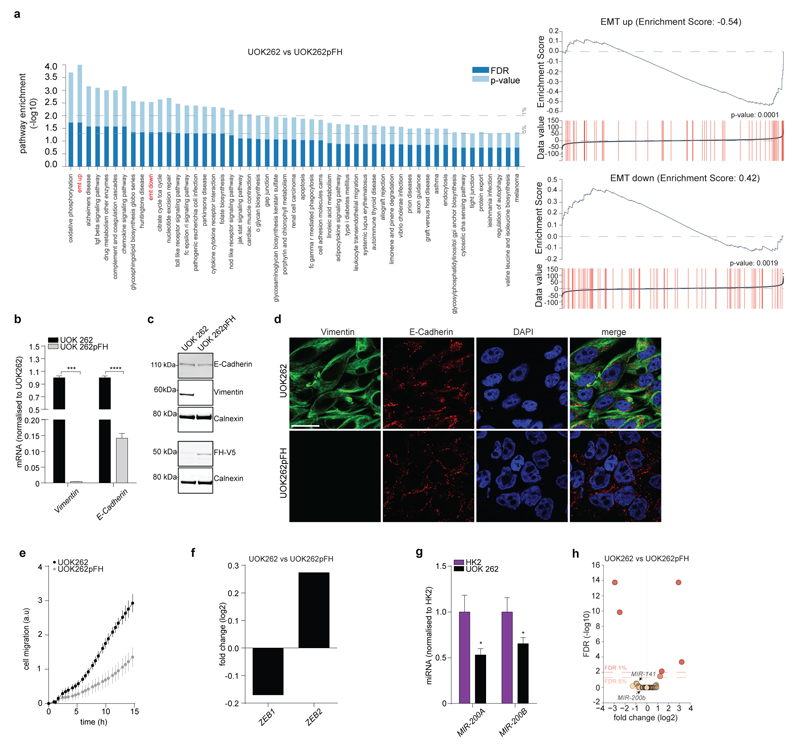
Extended Data Figure 3. EMT signature in UOK262 cells.
a, Gene set enrichment analysis and EMT enrichment score of the indicated cell lines. Gene expression was normalised to UOK262pFH. b, c, mRNA expression measured by qPCR (b) and protein levels measured by western blot (c) of the indicated EMT markers. d, Immunofluorescence staining for Vimentin and E-Cadherin. DAPI was used as marker for cell nuclei. Scale Bar = 25 µm. e, Cell migration rate. Results were obtained from 14 replicate wells and presented as mean ± S.D.. f, mRNA expression of EMT-related transcription factors ZEB1 and ZEB2 from RNA-seq data as in Fig. 1a. g, Expression levels of the indicated miRNAs measured by qPCR. h, Volcano plot of miRNA profiling. All qPCR experiments were obtained from 3 independent experiments and presented as RQ with max values, normalised to β-actin or RNU6B/SNORD61 as endogenous control for mRNA and miRNA analyses, respectively. *P ≤0.05, **P ≤0.01, ***P ≤0.001, ****P≤0.0001. Western blot sources are presented in Supplementary Figure 1. Raw data are presented in SI Table 2.

