
Figure 3. Tryptophan metabolites and spleen histology of 2F5 VHDHJH + VLJL knock-in mice.
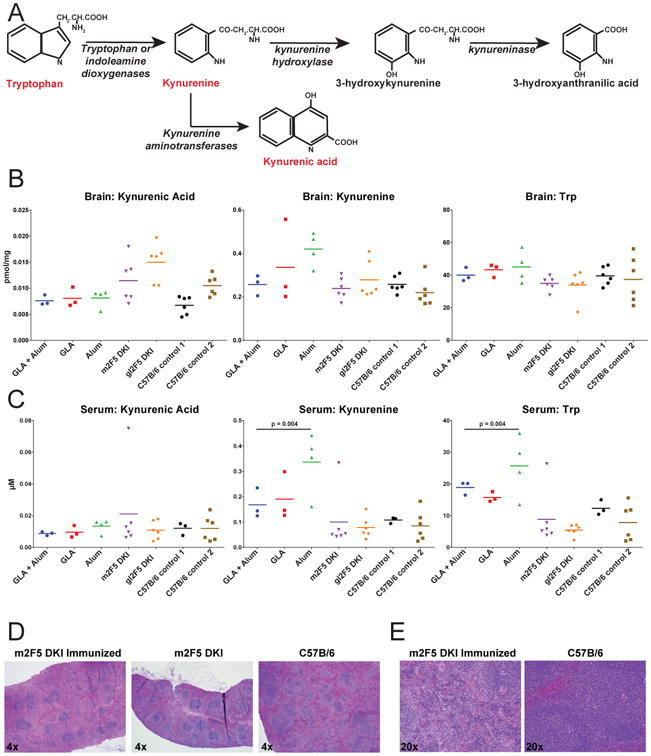
(A) The first 3 steps of tryptophan metabolic pathway with monitored metabolites highlighted in red. (B-C) Tryptophan metabolite levels in (B) brain and (C) serum of MPER peptide-liposome-immunized m2F5 DKI mice formulated with GLA + Alum, GLA or Alum, unimmunized 2F5 DKI mice with the mutated (m2F5 DKI) and germline 2F5 knocked-in (gl2F5 DKI) and two groups of C57B/6 control mice (P-values determined by Wilcoxon-Mann-Whitney). Levels of individual animals graphed. Line graphed at group mean. (D) HE stains at 4× magnification of spleens from m2F5 DKI MPER peptide-liposome-immunized mice, unimmunized m2F5 DKI mice and control C57B/6 mice. (E) HE stains at 20× magnification of spleens from m2F5 DKI immunized and C57B/6 mice.