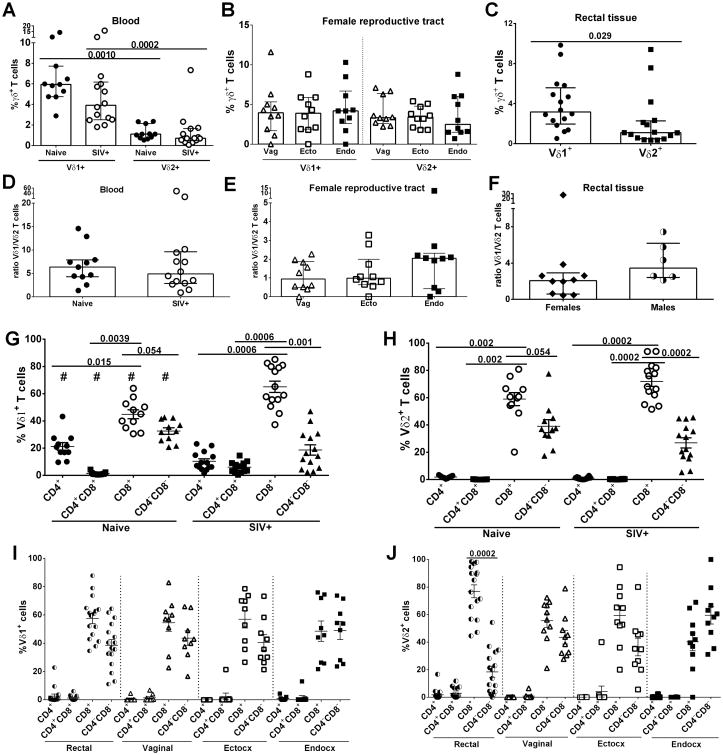
Figure 1. γδ T cell distribution in naïve and SIV-infected macaques.
Peripheral blood, rectal tissue and FRT tissue: vagina, ectocervix and endocervix were collected, processed and used for phenotypic analysis. Percentage of γδ T cells subsets in blood (A), FRT (B) and rectal tissue (C). Ratio of Vδ1+/Vδ2+ T cells in blood (D), FRT (E) and rectal tissue (F) of RMs. CD4 and CD8 expression in Vδ1+ (G and I) and Vδ2+ (H and J) subsets in blood, rectal tissue and FRT respectively. Only chronically SIV-infected macaques were included in the analysis of rectal and FRT tissues. #p<0.02 naïve vs SIV+. Results are expressed as median with IR (A – F) and mean ± SEM (G – J).

