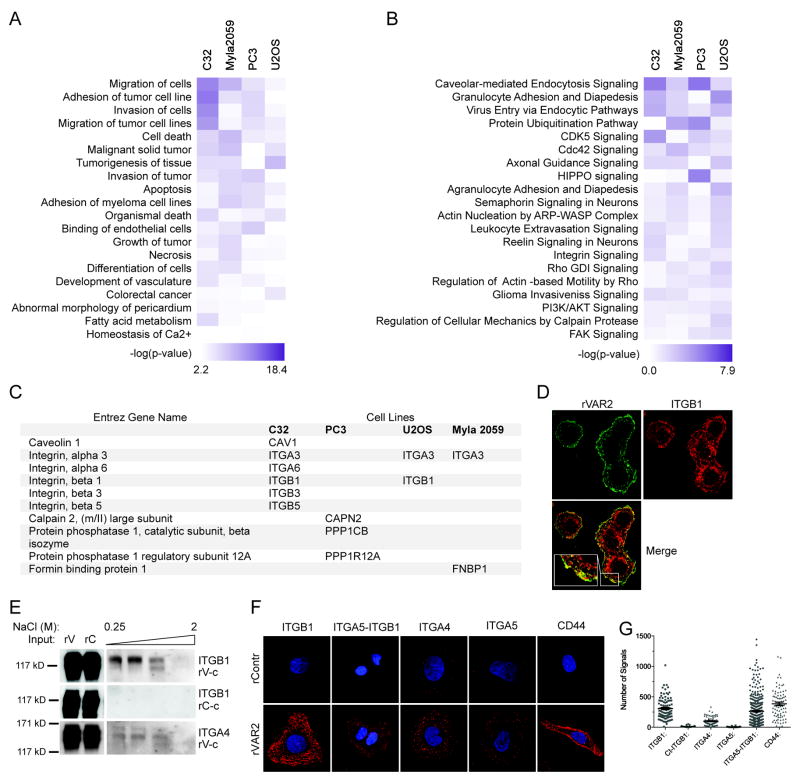
Figure 3. The CS-modified tumor cells proteome in enriched for proteins involved in motility.
A, Network analysis of pulled down proteins using the Ingenuity Pathways Analysis (IPA) software. Proteins that were found to be significantly different between rVAR2 and rControl in the pulldown analysis were analyzed. The top 20 diseases and bio functions involved are shown in a heat Map. We generated the heat map by comparing independent analyses of rVAR2 pull downs in different cell lines. B. IPA heat map analysis of canonical pathways most significantly enriched in proteins pulled-down with rVAR2. C, List of the significant rVAR2 pulled-down proteins involved in the Integrin signaling. D, Co-localization analysis between of-CS (rVAR2 stain (green)) and ITGB1 antibody stain (red). E, Column based pulldown of integrin subunits using rVAR2 (rV-c) from U2OS cells. Figure shows western blot analysis of eluates in increasing NaCl concentration. An rContr coupled column is used as negative control (rC-c). F, PLA analysis of co-localization between ofCS (rVAR2 stain) and integrin subunits. CD44 is used as the positive control. G, Quantification of the PLA analysis.

