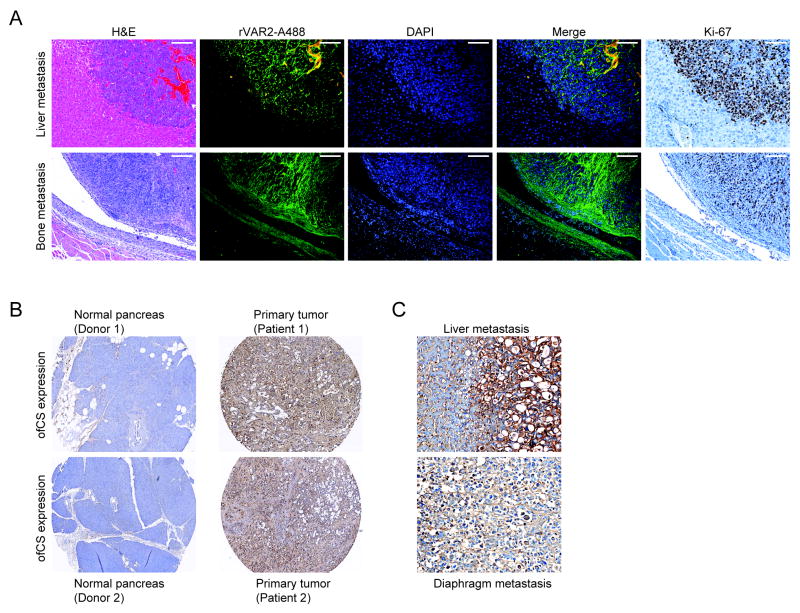
Figure 5. Expression of oncofetal CS in metastatic lesions.
A, H&E images (left panel), Immunofluorescent (rVAR2-Alexa 488, DAPI and merged; middle panel) and Ki-67 cell proliferative marker staining (right panel) images of murine liver and bone metastases derived from Balb-C mice inoculated with 4T1 murine mammary cancer cells by intra-cardiac injection. The scale bars represent 100 μm.
B, Immunohistochemical analysis of ofCS, stained with rVAR2-V5 using anti-V5-HRP antibody, in human normal pancreas (left panel), pancreatic cancer tissues (right panel) and, C, liver and diaphragm metastases.

