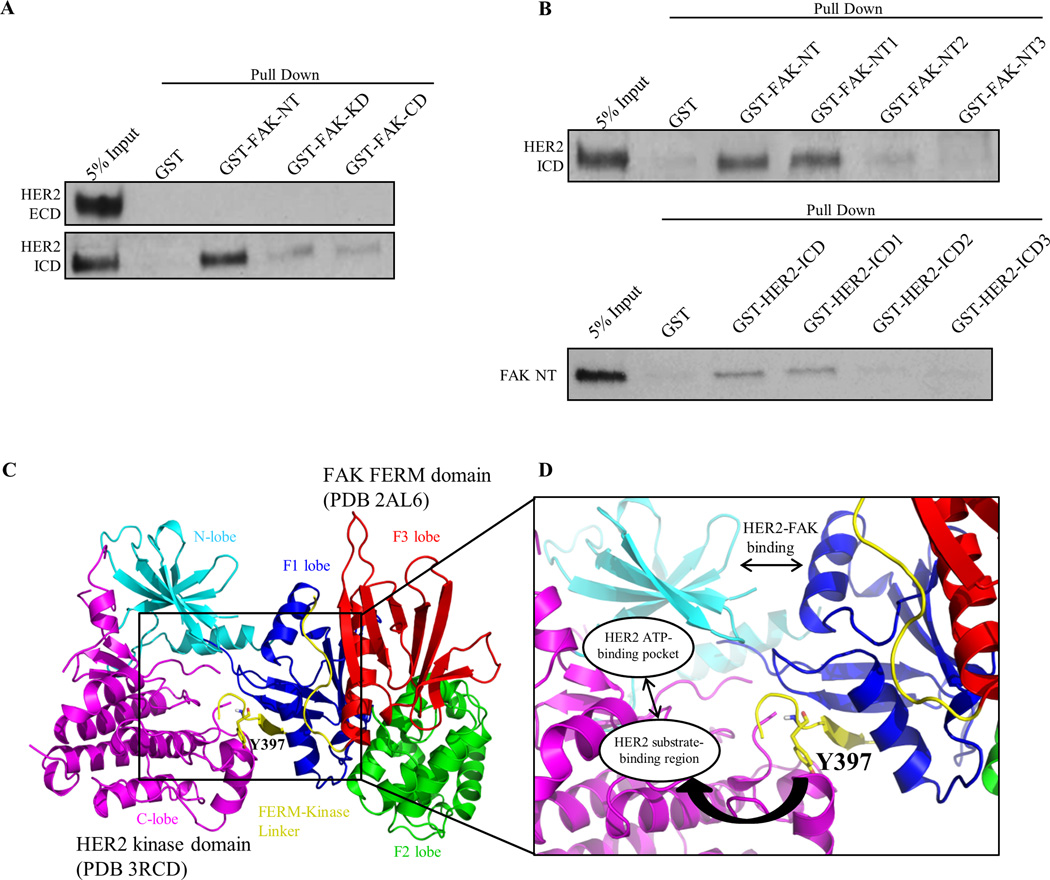
Fig. 3. HER2 directly binds FAK as a structural mechanism to promote Y397 phosphorylation.
(A) GST pull-down assays demonstrating direct binding of FAK-NT (N-terminal domain) to HER2-ICD (Intracellular domain). GST, GST-FAK-NT, GST-FAK-KD (Kinase domain), and GST-FAK-CD (C-terminal domain) proteins were incubated with HER2-ECD (Extracellular domain) or HER2 ICD (Intracellular domain) proteins and resulting immunoblots represent the bound fraction. (B) Upper panel: GST pull-down assays showing direct binding of FAK-NT1 (FERM-F1 lobe) to HER2-ICD. GST-FAK-NT1, GST-FAK-NT2, and GST-FAK-NT3 were cloned according to FAK-FERM-F1, -F2, and -F3 lobes, respectively. Lower panel: GST pull-down assays showing direct binding of HER2-ICD1 (kinase N-lobe) to FAK-NT (FERM). GST-HER2-ICD, -ICD1, -ICD2, and -ICD3 were cloned according to HER2-ICD, kinase N-lobe, kinase C-lobe, and c-terminal tail regions, respectively. Images shown are representative of three independent experiments. (C) Structural model of the HER2-FAK interaction as determined by HADDOCK docking studies. The N-lobe (cyan) and C-lobe (magenta) of the HER2 kinase domain (PDB 3RCD) as well as the F1 lobe (blue), F2 lobe (green), F3 lobe (red), and FERM-kinase linker (yellow) of the FAK FERM domain (PDB 2AL6) are depicted. The model shown represents the top-ranked cluster in HADDOCK. (D) Zoomed inset of the HER2-FAK model showing proximity of the binding interface to Y397 of the FERM-kinase linker region and orientation of Y397 within the HER2 substrate-binding region. All images were created in PyMOL

