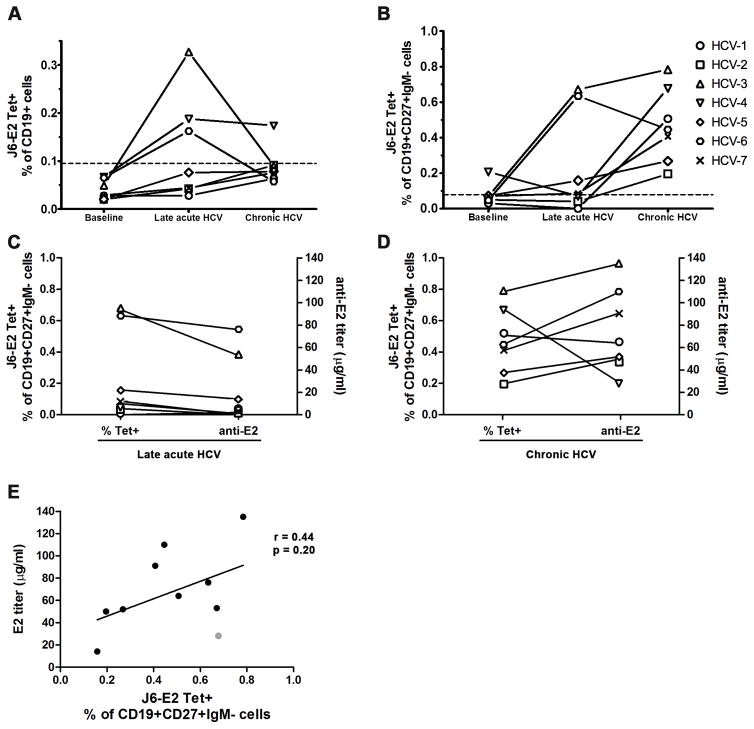
FIGURE 4. Longitudinal analysis of HCV E2-specific B cells during acute HCV infection progressing to chronicity.
J6-E2 tetramer positive B cells were detected longitudinally in individuals that developed a chronic HCV infection (n=7) as described in Figure 3. Three key time points were tested: Baseline (> 1.5 months prior to estimated date of infection (EDI)); Late acute (5±2 months post EDI); and Chronic HCV (>12 months post EDI). Each dot represents the percentage of tetramer positive cells from one subject in total CD19+ B cells (A) and in class-switched memory B cells (CD19+CD27+IgM−) (B). Dotted line (A–B) represents the threshold for tetramer positive signal.
(C–D) Plasma anti-E2 IgG titers were measured by ELISA and compared to the tetramer frequencies for the late acute time point (C) and Chronic HCV time point (D) (both n=7). (E) Correlation between anti-E2 titers and J6-E2 tetramer positive frequencies from class-switched memory B cells. Spearman r and p values are indicated. ELISAs were done in three independent experiments and the results are shown from one representative experiment in duplicate.

