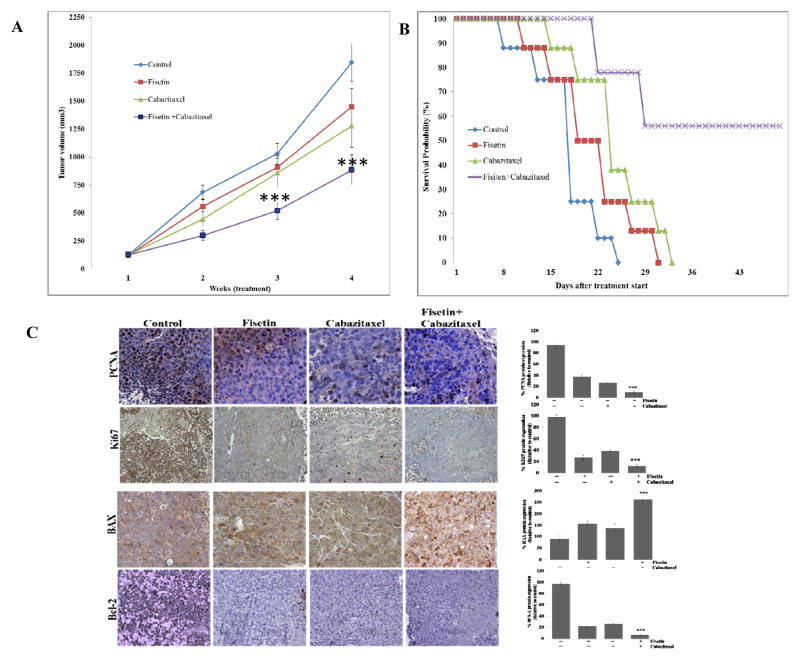
Figure 3. Effect of treatment with fisetin, cabazitaxel and their combination on tumor growth and metastasis in mice implanted with 22Rν1 cells.
A. Line graph showing tumor volume growth determined by weekly measurements. Each value in the graph is the mean ± SE from six mice. ***, p ≤ 0.0005 was considered as significant. B. Line graph showing survival analysis. C. At the end of study, tumors were harvested from mice, subjected to IHC for proliferation (anti-ki67) and (anti-PCNA) and apoptosis (anti- BAX) and (anti-Bcl-2). Left, representative photomicrographs of Ki67, PCNA, BAX and Bcl-2-stained tumor section (40x). Right, quantitation of Ki67, PCNA, BAX and Bcl-2; ***, p ≤ 0.0001.

