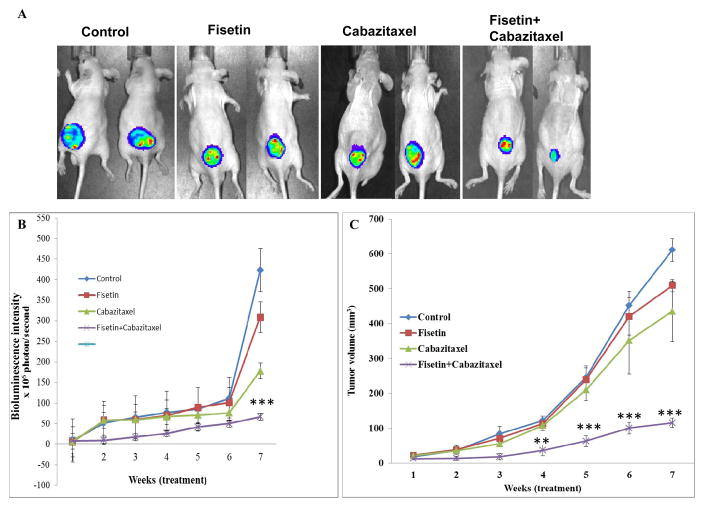
Figure 4. Effect of treatment with fisetin, cabazitaxel and their combination on tumor growth in a subcutaneous PC3M-luc-6 xenograft model.
A. Representative bioluminescence of PC3M-luc-6 tumor-bearing mice at the 7-week of treatments. B. ROI intensity as determined by bioluminescence. Each value in the graph is the Mean ± SE from six mice. ***, p ≤ 0.0005 was considered as significant. C. Line graph showing tumor volume growth determined by weekly measurements. Each value in the graph is the mean ± SE from six mice. ***, p ≤ 0.0001 was considered as significant.

