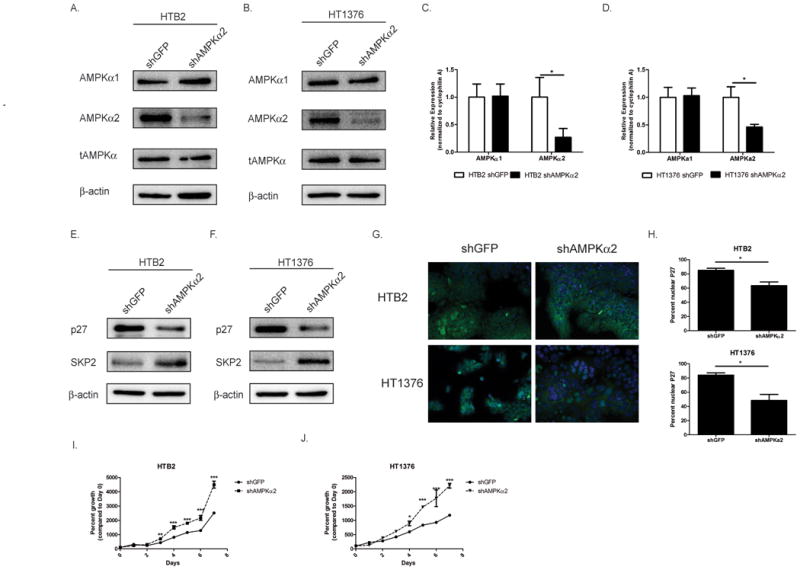
Figure 3. AMPKα2 knockdown reduces p27 through a SKP2-mediated mechanism and results in a proliferative advantage.

A-B. HTB2 (A.) and HT1376 (B.) cells were transduced with shRNA to GFP or AMPKα2 and stable cell lines were created. HTB2 and HT1376 stable cell lines were assessed by immunoblot for AMPKα1, AMPKα2, total AMPK (α1/α2) and β-actin. C-D. Transduced cells (see 3A &3B) were assessed by qRT-PCR for AMPKα1 and AMPKα2 mRNA levels. E-F. HTB2 shGFP, HTB2 shAMPKα2, HT1376 shGFP and HT1376 shAMPKα2 cells were assessed by immunoblot analysis for p27, SKP2 and β-actin. G. HTB2 and HT1376 stable cell lines were stained with p27 (green) and DAPI (blue). H. Quantification of staining in G. I-J. HTB2 and HT1376 stable cells were plated and cell counts were taken daily over 7 days. Graphs represented as percent growth of Day 0 cell count. Statistical significance indicated as; *p<0.05, **p<0.01, ***p<0.001
