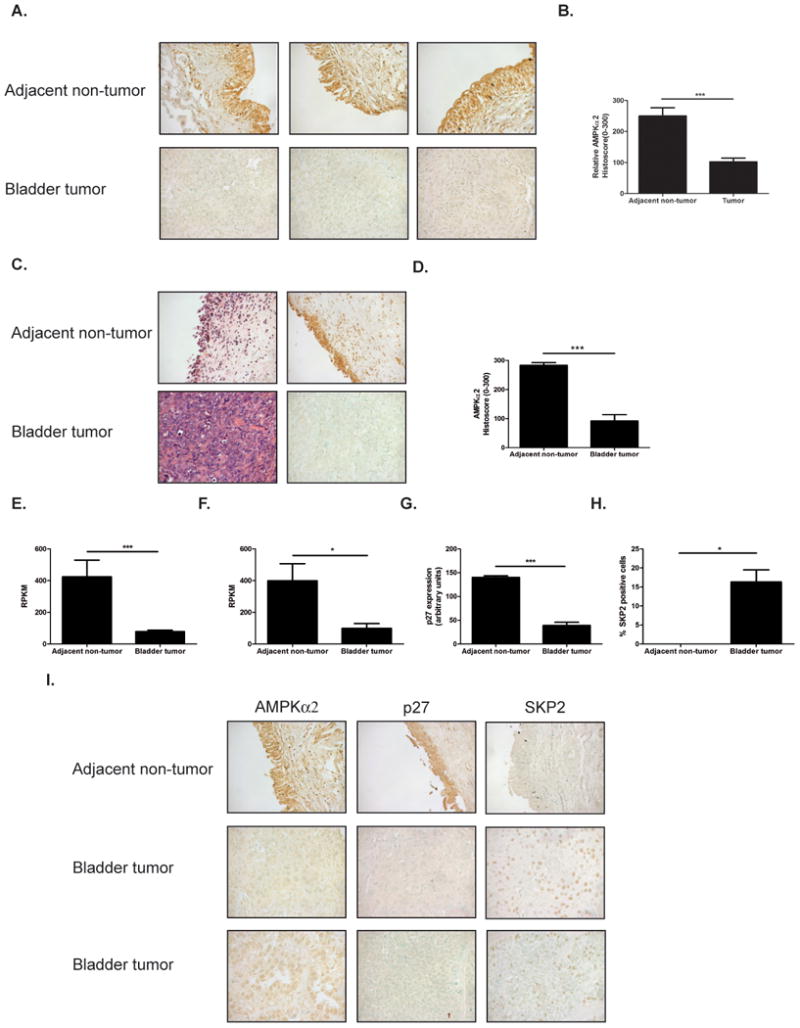
Figure 7. AMPKα2 suppression in bladder cancer correlates with p27.

A. Representative 40× images of adjacent non-tumor and bladder tumor tissue stained for AMPKα2. Images represent an example of low AMPKα2 expression and high AMPKα2 expression in bladder tumor samples. B. Quantification of AMPKα2 expression in adjacent non-tumor and bladder tumor samples (n=10 adjacent non-tumor and n=40 tumor). C. Representative 40× images of patient matched adjacent non-tumor and bladder tumor tissue stained for AMPKα2. D. Quantification of patients matched samples (n=15). E. AMPKa2 mRNA in 19 adjacent non-tumor and 164 bladder tumor samples. (Represented as reads per kilobase of transcript per million mapped reads, RPKM). F. AMPKa2 mRNA in 15 patient matched adjacent non-tumor and bladder tumor samples (Represented as RPKM). G. Quantification of p27 staining from array (n=10 adjacent non-tumor and 40 bladder tumor) H. Quantification of SKP2 staining from array (n=10 adjacent non-tumor and 40 bladder tumor) I. Representative 40× images of AMPKα2, p27 and SKP2 staining in adjacent non-tumor and bladder tumor samples. Statistical significance indicated as; *p<0.05, ***p<0.001 The data presented in this figure is generated in part by data gathered by the TCGA Research Network.
