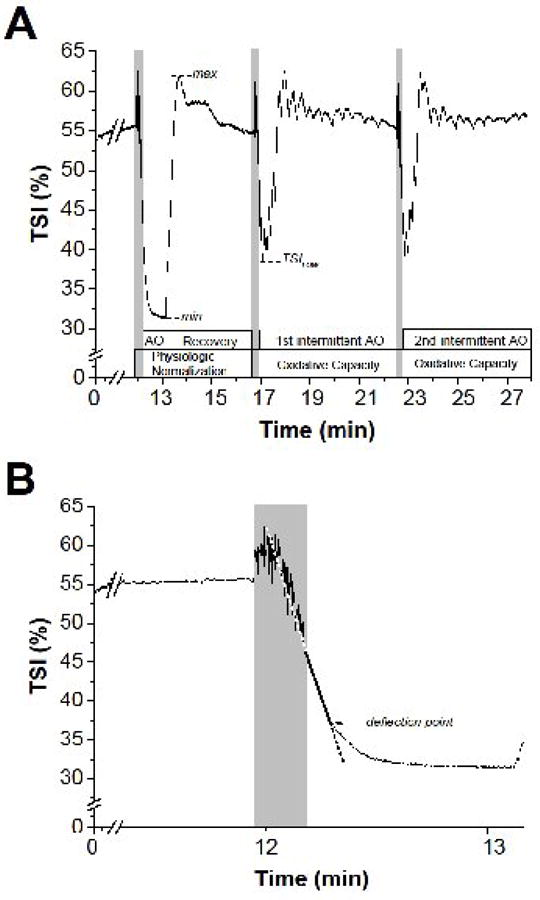
Figure 1. Tissue saturation index (TSI, %) changes during the NIRS muscle assessment.

Panel A. Protocol phases, and the parameter calculated from the analyses of TSI signal changes, are indicated at the bottom of the graph. Grey shading indicates brief dynamic plantar-flexion exercise. AO = arterial occlusion; max and min = highest and lowest TSI values during the Physiologic Normalization (PN) phase; TSILOW = lowest saturation value reached during oxidative capacity assessments (for further details see Methods). Panel B. Expansion of panel A to illustrate the linear regression to determine the deflection point of muscle TSI (arrow) during the sustained arterial occlusion (AO). Grey shading indicates brief dynamic plantar-flexion exercise.
