
Figure 2. Representative COPD (A, B) and control (C, D) participants’ responses during the muscle oxidative capacity assessment.
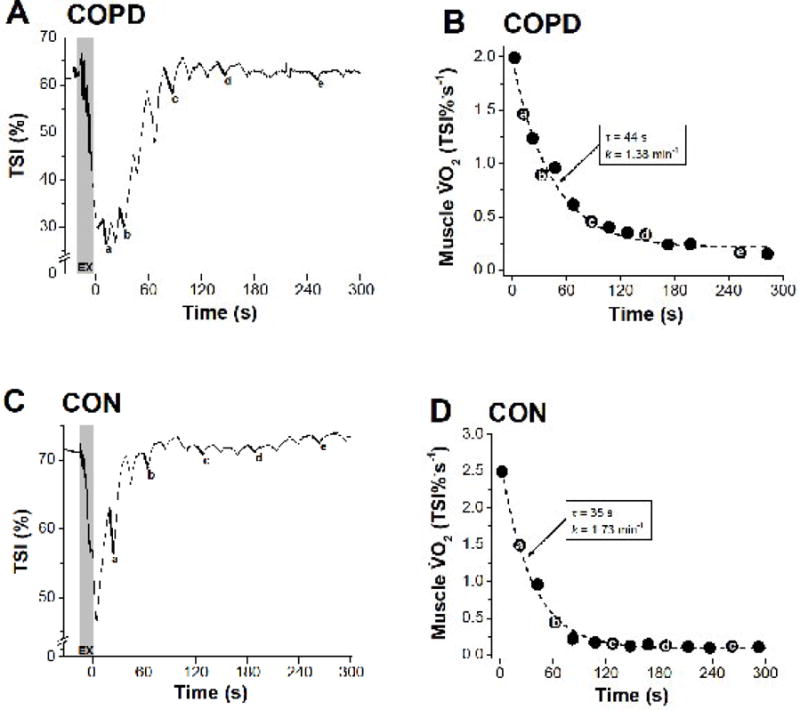
Panels A and C show the TSI profiles during dynamic exercise, and intermittent arterial occlusion during recovery. Panels B and D show the calculated muscle recovery profiles and kinetic fit (dashed line). The letters (a–e) are given to illustrate how the corresponding value is derived from respective TSI negative slopes during intermittent occlusions. The grey area (EX) indicates the brief dynamic exercise. τ (s) is the time constant determined by non-linear least-squares regression. k, is the rate constant, which is linearly related to muscle oxidative capacity (k = (1/τ).60, min−1).