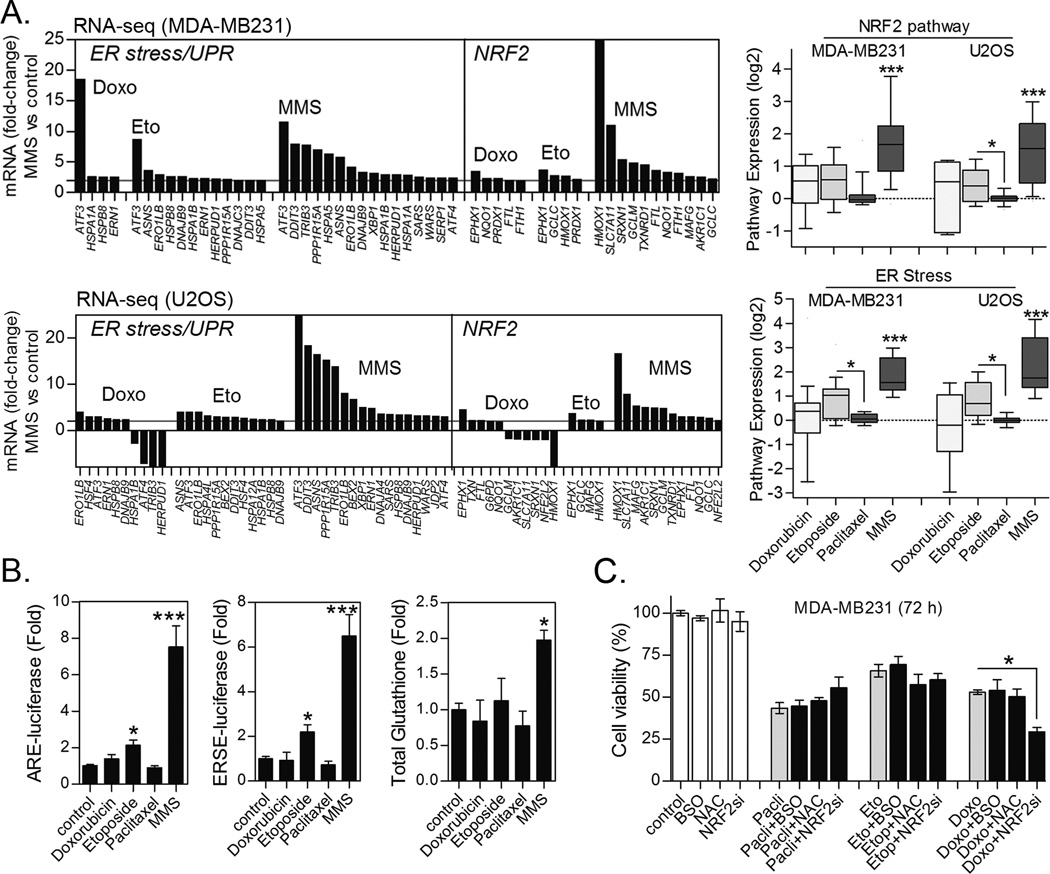
Figure 5. Activation of NRF2 and ER stress pathways in response to alkylating agents as compared to other chemotherapeutics.
(A) The most significant mRNA fold-changes in ER stress and NRF2 pathway markers as determined by RNA sequencing of MDA-MB231 and U2OS cells treated for 8 h with chemotherapeutics and MMS (see Methods). NRF2 and ER stress pathway expression index for each tested drug is also shown. (B) Comparative effect of chemotherapies on ERSE- and ARE-luciferase reporter gene activities and total glutathione content in MDA-MB231 cells treated for 8 h. (C) Impact of NAC and BSO pre-treatments and NRF2 knockdown on the cytotoxicity of non-alkylating drugs in MDA-MB231 (72 h treatment). Figs. “B and C” data are represented as the average ± SD of a representative experiment performed in triplicate and repeated at least thrice. *different from untreated or at indicated comparisons; ***different from all other groups (p<0.05, ANOVA/Tukey for “B–C”; Kruskal-Wallis/Dunn’s for “A”).

