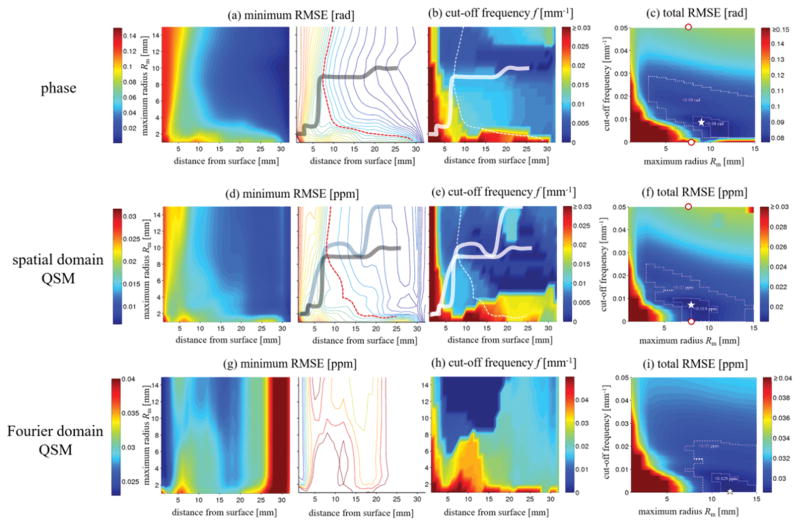
Figure 5.
Numerical analysis of the effect of V-SHARP parameters on phase (first row) and susceptibility (second and third rows). a) Minimum obtainable RMSE (mRMSE) for all regularization parameters of background corrected phase images (color-coding; in rad) as a function of the distance from the brain’s surface (x-axis) and the maximum sphere radius (y-axis). The left images shows a color map, the right image shows a contour map for an improved visualization of parameter settings with equal RMSE. The solid line connects the points of the minimum distance from the surface for a certain RMSE (contour lines). The dashed red line marks an RMSE of 0.06 rad. b) cut-off frequencies corresponding to the mRMSE in (a). Solid and dashed lines were reproduced from (a). c) Total RMSE (tRMSE, over the whole brain; color-coding; in rad) of the background corrected phase as a function of Rm (x-axis) and the cut-off frequency (y-axis). The outlined regions mark errors below 0.09 and 0.08 rad, respectively. The white star marks the point with the minimum RMSE. d) Minimum obtainable RMSE for all regularization parameters of spatial domain QSM susceptibility maps (color-coding; in ppm). The gray solid line was reproduced from (a), the solid blue line connects the points of the minimum distance from the surface for a certain RMSE (contour lines). The dashed red line marks an RMSE of 0.15 ppm. e) Cut-off frequencies corresponding to the minimum RMSE reconstructions in (d). (f) Total RMSE of susceptibility maps. The outlined regions represent RMSEs below 0.02ppm and 0.019ppm. Panels g) to i) show results of the Fourier domain QSM algorithm, analog to panels d) to f), with the outlined regions representing RMSEs below 0.03ppm and 0.029ppm. The white star marks the minimum susceptibility RMSE. The red dots in (c) and (f) mark the parameter values of the exemplary cases illustrated in Figure 4. Please note the difference in color bar scales between panels d)–f) and g)–i). Gouraud shading was used for all color maps.

