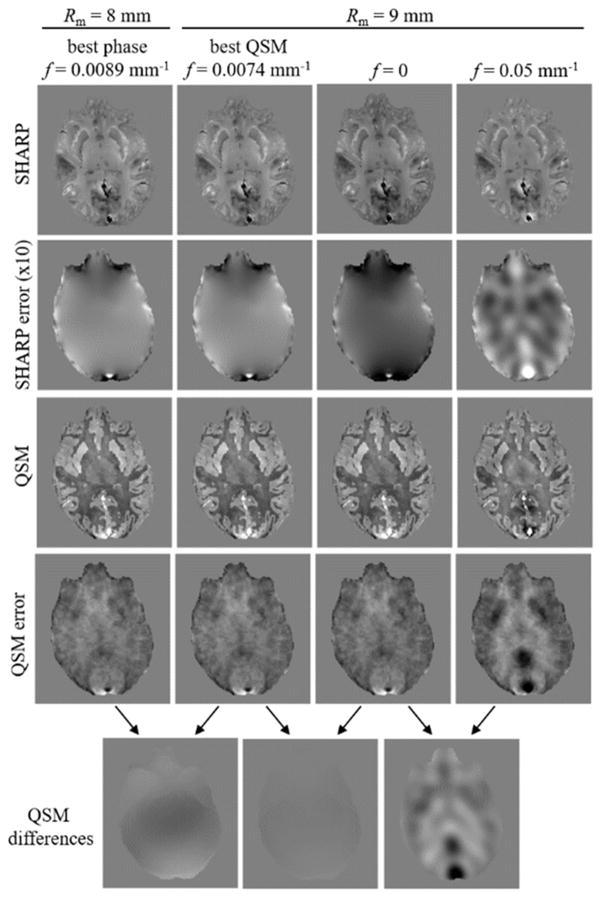
Figure 6.
Comparison of phase images and (spatial domain) susceptibility maps for different parameter configurations in the numerical model. The two left-most columns were obtained with parameter settings yielding the best background corrected phase and susceptibility map, respectively (stars in Fig. 5, c and f). The two right-most columns were obtained with values that led to reduced phase reconstruction quality (red dots in Fig. 5, f). Note that choosing f=0 had a substantial effect on the phase reconstruction, but a negligible effect on the susceptibility map reconstruction. The contrast (black to white) of all susceptibility (error) maps is [−0.1…0.1] ppm. The contrast of all phase images and phase error images is [−1…1] rad and [−0.3…0.3] rad, respectively.

