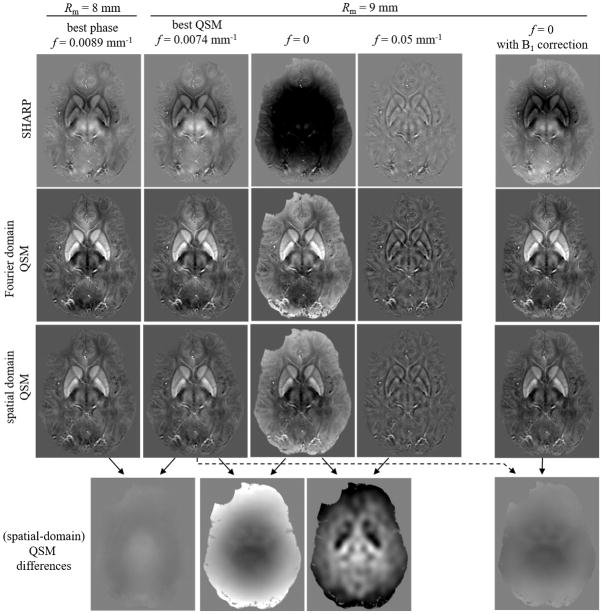
Figure 8.
Comparison of phase images and susceptibility maps for different parameter configurations in vivo. The first four columns from the left are analog to Fig. 6. Since ground truth phase and susceptibility distributions were unavailable in vivo, only the background corrected phase and the susceptibility maps are shown. The bottom row shows difference images of the spatial domain susceptibility maps. Results confirm the numerical simulations (Fig. 6), except that the susceptibility distribution for f=0 substantially deviates from the f=0.0074 mm−1 (bottom row, second from left). The right-most column shows the results obtained with f=0 when the B1-phase contribution was subtracted from the input phase image before applying SHARP. All images are mean value projections over 4.8 mm to improve anatomical contrast. The contrast (black to white) of all susceptibility (error) maps is [−0.1…0.2] ppm ([−0.1…0.1] ppm). The contrast of all phase images and phase error images is [−0.9…0.9] rad and [−0.27…0.27] rad, respectively.

