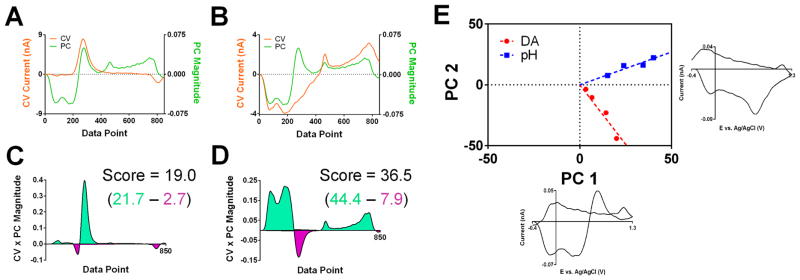
Figure 2.
Scoring process of principal component analysis. (A) CV of dopamine standard (orange) and the first principal component (green) shown in the “unwrapped” format. (B) As in (A) but with a pH standard. (C) Plot showing the value of product of the principal component and current amplitudes (wnΔin from eq 6) from (A) for each data point. The regions beneath positive and negative values of this calculation are shown in green and purple, respectively, to assist with conceptualization of the score calculation, which is calculated from summation across the data window (see text). (D) As in (C) but using the PC and CV amplitudes from (B). (E) Cook’s distance plot showing the scores for each CV on the first two principal components for the training set presented in Figure 1. Each axis corresponds to the adjacent principal component, and each training CV is shown as a point on the plot whose coordinates are defined by its scores on the corresponding principal component.

