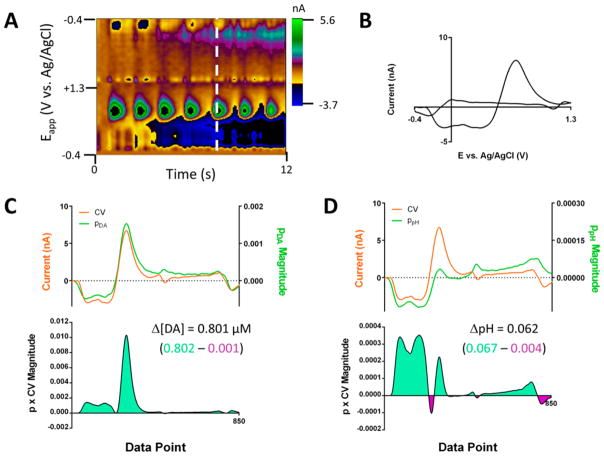
Figure 3.
Use of the p vectors in the calculation of analyte concentrations. (A) Color plot showing dopamine and pH shifts from a lever press-induced electrical stimulation for an animal performing intracranial self-stimulation. (B) Cyclic voltammogram, showing contributions from pH and dopamine, collected at the white vertical line shown in (A). (C) Plots of the dopamine p vector and the CV from (B) (upper) and the value of the product of their amplitudes (lower) for each data point. Analogous to the scoring process show in Figure 2, the concentration is calculated from summation across the data window, and the regions below positive and negative values of the p and CV product are shown in green and purple, respectively. (D) As in (C) but with the ppH matrix.

