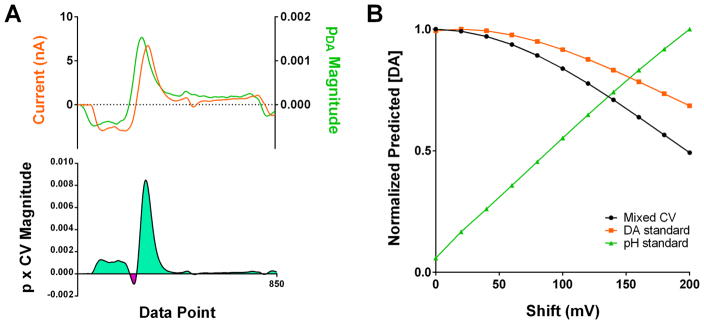
Figure 4.
Errors in the use of nonexperimental training sets. (A) Plots of the pDA matrix and the CV from Figure 3B with an artificial rightward 100 mV shift (upper), and the value of the product of their amplitudes (lower) for each data point. (B) Plot of the predicted DA concentration, normalized to the maximum predicted value, as a function of the artificial shift magnitude introduced for the mixed CV from Figure 3B (black) and a DA (orange) and pH (green) standard from Figure 1A.

