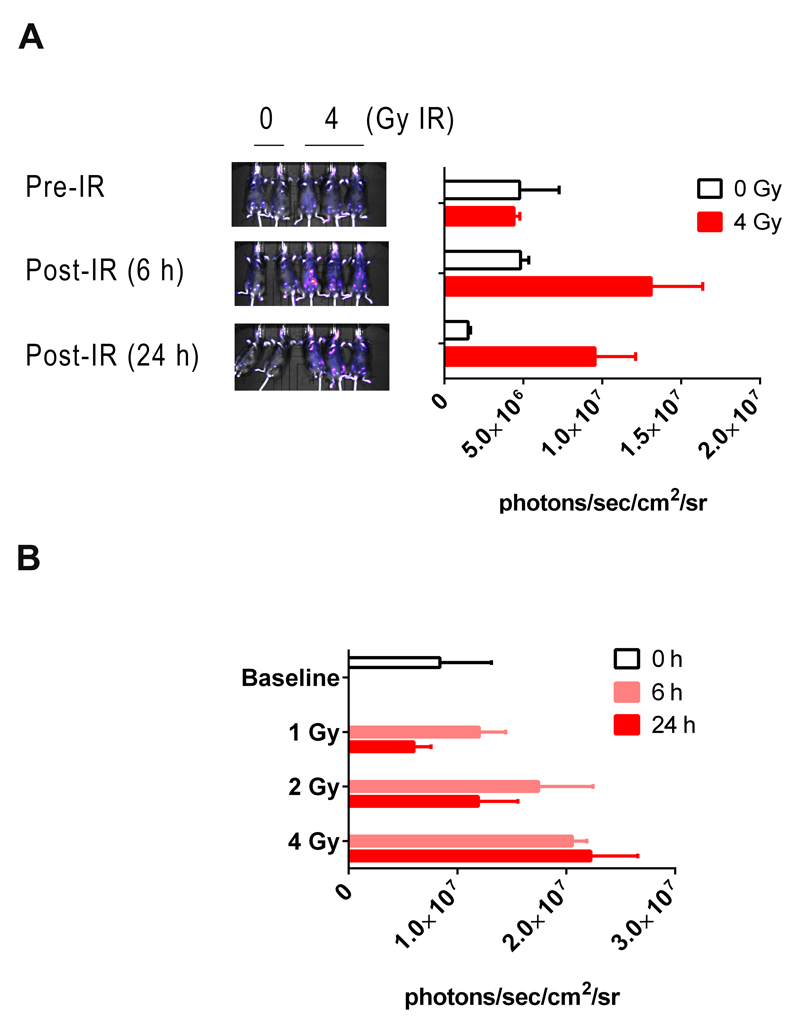
Figure 4. Bioluminescent in vivo imaging of reporter mice following IR.
A) Five heterozygous reporter mice were pre-imaged. Two of the mice were sham-irradiated whereas the remaining three were exposed to a single dose of 4 Gy of IR. Sham- (0 Gy) and irradiated mice (4 Gy) were re-imaged 6- and 24 h after exposure. Quantification of photon fluxes at the 24 h time-point is shown in the accompanying bar chart (x ± SD, n = 3 or 2 mice). B) 12 mice were in vivo imaged and randomly assigned to receive 0-, 1-, 2-, or 4 Gy of IR. Mice were in vivo imaged 6- and 24 h later (x ± SD, n = 3 mice).

