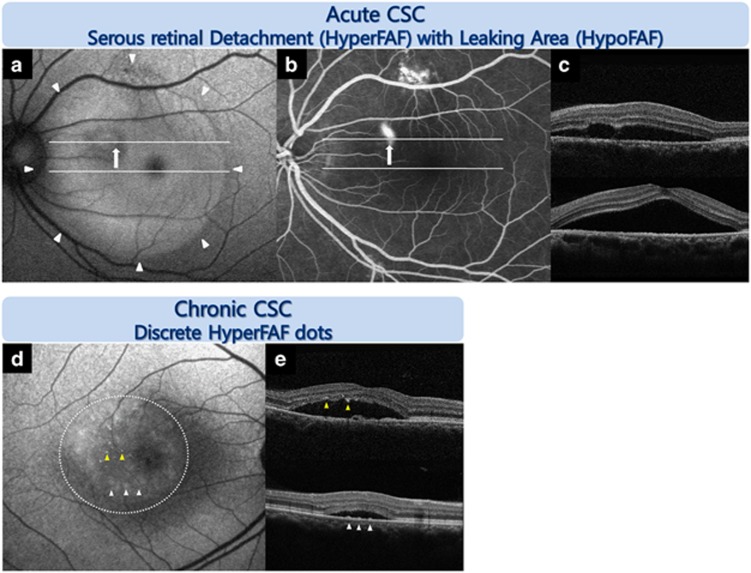
Figure 1.
Representative FAF images from an eye with idiopathic CSC according to the chronicity of the disease. Acute CSC: FAF image (a) showing hyper-FAF in the area of SRD (white arrowhead) obtained by SD-OCT image (c) and hypo-FAF at the leaking area (white arrow) obtained by fluorescein angiography (FA) (b). Chronic CSC: discrete small dots with increased FAF intensity were observed (d). One pattern showed a greater number of tiny, discrete dots with intense hyper-FAF that corresponded to hyper-reflective dots attached to the posterior surface of the detached retina on SD-OCT (yellow arrowhead) (e). Another pattern showed more frequent, larger, diffuse, and vague hyper-FAF spots that corresponded to the accumulation on the bottom of the SRD, which appeared to be the RPE protrusion on SD-OCT (white arrow; e).

