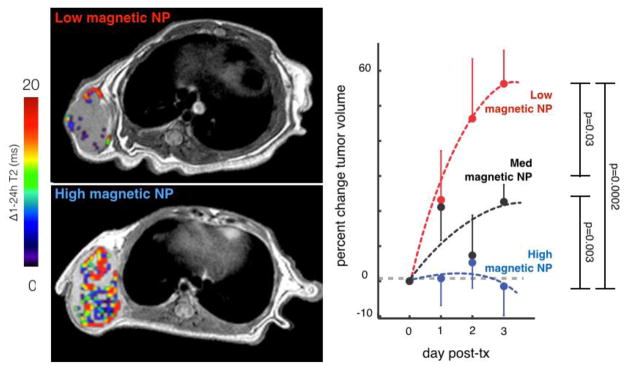
Fig. 8.
MRI of magnetic NPs predicts therapeutic NP efficacy. Left: Example cross-sectional T2 images of tumors accumulating low and high intratumoral magnetic NP, with a pseudo-color overlay to indicate the difference in T2 within the manually segmented tumor region. Right: Pre-therapeutic MRI of magnetic NPs predicts accumulation and response to paclitaxel-loaded NPs. Tumor progression in HT1080 tumors was ranked according to low, medium, and high magnetic NP values as measured by MRI. Error bars denote S.E.M. (total n=33). Modified from ref. [Miller et al., 2015, Sci Transl Med, 7, 314ra183].

