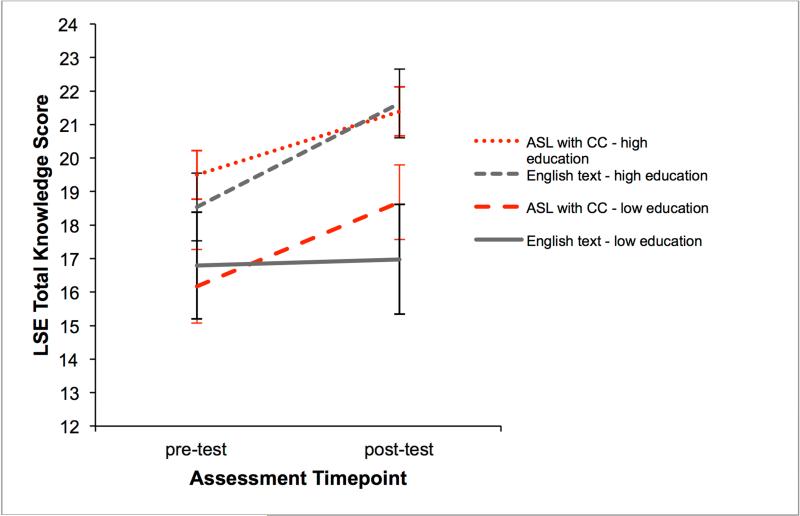
Figure 2. Change in Least Square Estimates of the Total Knowledge Scores by Subgroups.
Least square estimates of the total knowledge scores (95% CI) from between-groups repeated measures regression are plotted for each language modality, education group, and assessment timepoint. 290 of 300 possible observations used in the analysis. CC = closed captions; LSE = least squares estimate

