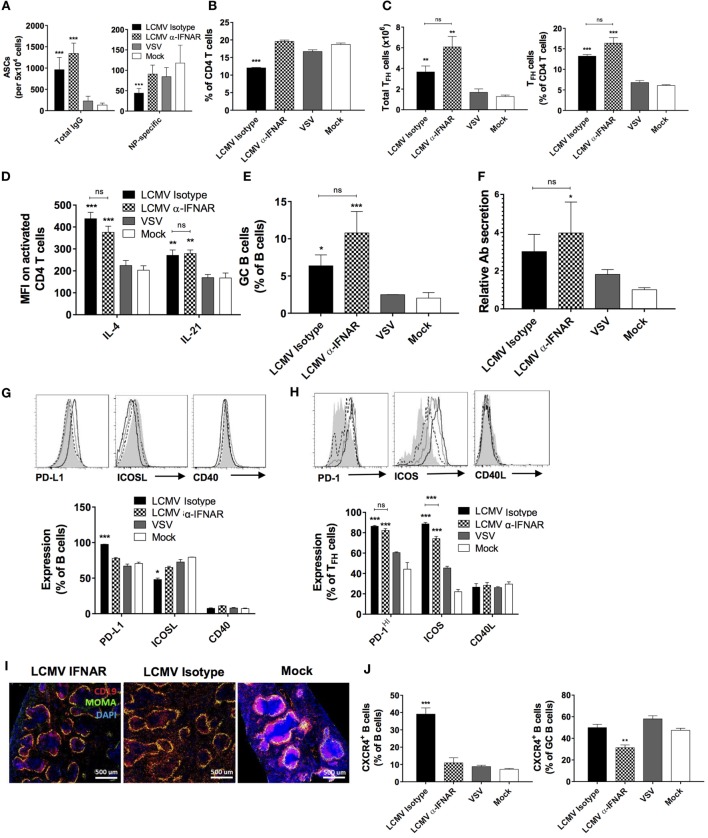
Figure 6.
IFNAR blockade partially restores TD B cell responses and splenic follicular structures. B6 mice (four per group) were treated with α-IFNAR Ab (checkered) or isotype control Ab (black) and were infected the next day with LCMV Cl13, VSV (gray), or mock infected (white). Mice were immunized the day of the infection with an i.p. injection of NP53-CGG in alum. IFNAR blockade was conducted every second day until analysis on d8. (A) Number of total (left panel) and NP-specific IgG-secreting (right panel) cells detected by ELISPOT. (B) Proportion of CD4 T cells among total lymphocytes and (C) total numbers (left panel) and proportions (right panel) of TFH cells among total CD4 T cells as determined by flow cytometry. (D) Intracellular IL-4 and IL-21 levels in TFH cells and (E) proportion of splenic GC B cells determined by flow cytometry. (F) Secretory capacity of ASCs as determined by measuring the quantity of secreted Abs produced by 105 splenocytes. (G) Proportion of B cells expressing PD-L1, ICOSL, and CD40. (H) Proportion of TFH cells expressing PD-1, ICOS, and CD40L. (I) Splenic follicular structures visualized using immunofluorescent staining of CD19 (red), MOMA-1 (green), and DAPI (blue) in tissue sections. (J) Proportion of CXCR4+ B cells among total (left panel) and GC B cells (right panel) determined by flow cytometry. Statistical analysis was performed by individual T-tests between experimental groups and the mock-infected group and between isotype and IFNAR blocking Ab-treated groups when indicated with brackets. *p < 0.05, **p < 0.01, and ***p < 0.001. (A,J) Representative of three independent experiments. (B–I) Representative of two independent experiments.

