Figure 3.
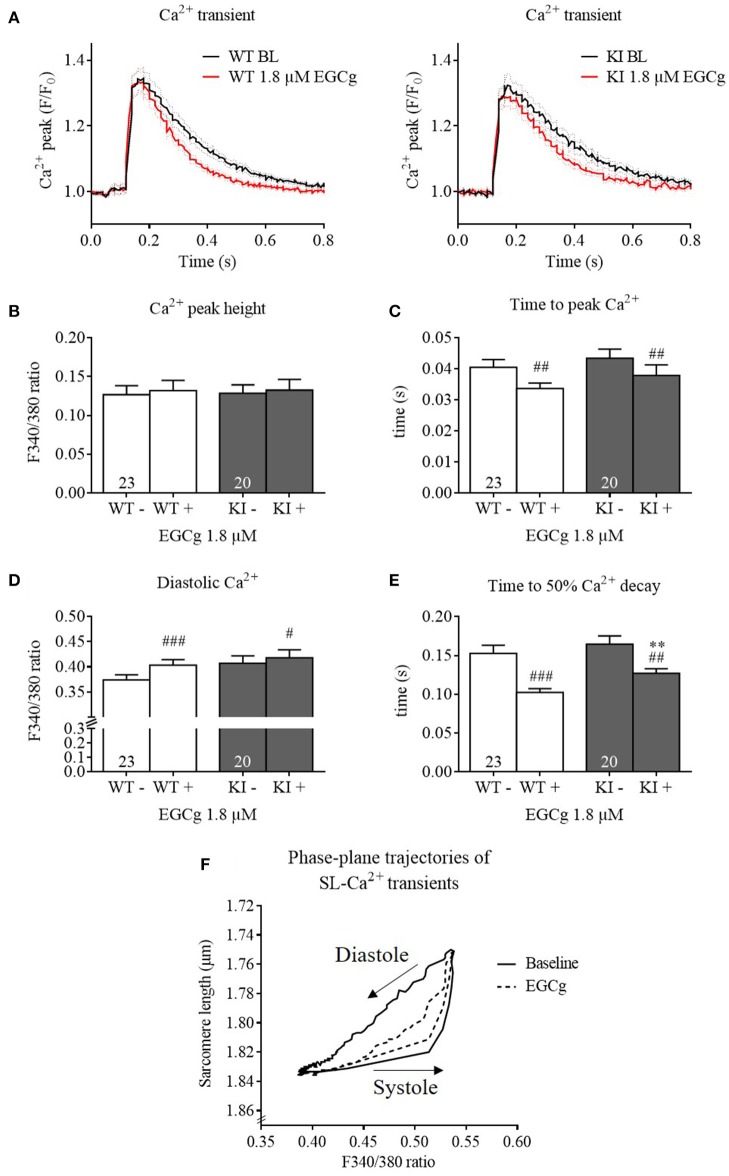
Ca2+ transients and kinetics of Mybpc3 WT and KI cardiomyocytes before and after treatment with EGCg. After isolation of cardiac myocytes from adult Mybpc3 WT and KI mice, paired (before/after EGCg) measurements of Ca2+ transients were performed in Fura-2 loaded cells. (A) Averaged Ca2+ transients of Mybpc3 WT and KI cells in baseline and with EGCg. (B) Ca2+ peak height, (C) time to peak Ca2+ (from stimulation to peak of 340/380 ratio), (D) diastolic Ca2+, and (E) time to 50% Ca2+ decay (from peak of 340/380 ratio to 50% decay) were analyzed. (F) Sarcomere length of Mybpc3 WT cells plotted against the Fura-2 signal ratio F340/380 indicating the Ca2+ transient in the absence (black loop) or presence (dotted black loop) of 1.8 μM EGCg, respectively. Loops proceed in a counter-clockwise direction. **P < 0.01 vs. WT in the same condition, unpaired Student's t-test; #P < 0.05, ##P < 0.01 and ###P < 0.001 vs. baseline, paired Student's t-test, n = 20–26, N = 5. For loops: n = 9.

