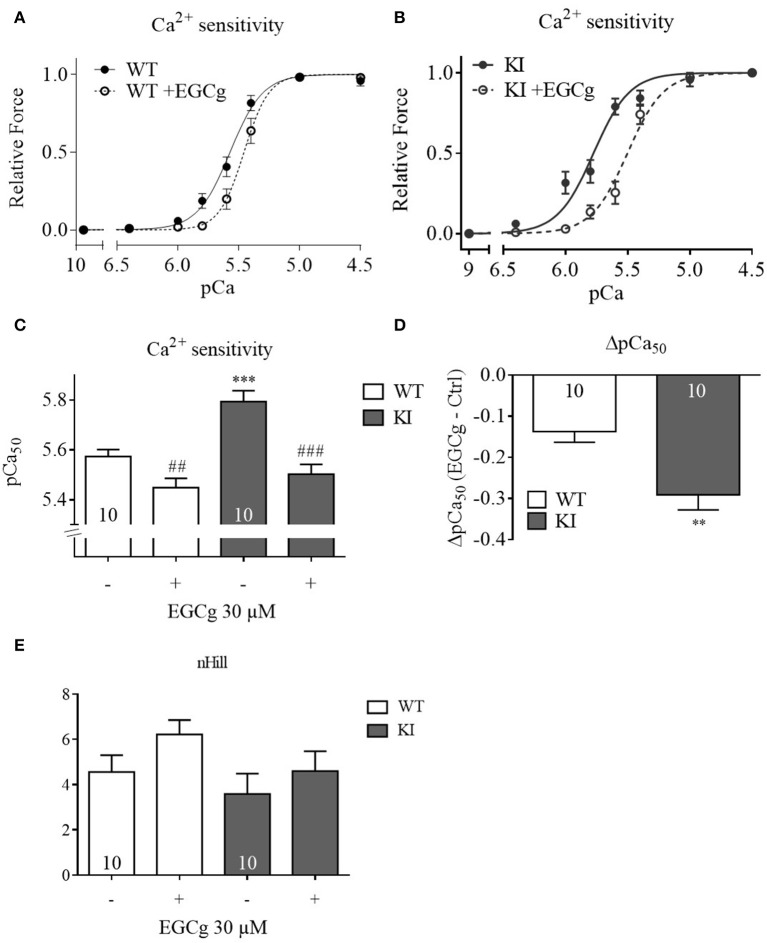
Figure 4.
Force-Ca2+ relationship of permeabilized cardiac muscle strips of WT and KI mice before and after treatment with 30 μM EGCg. Force-Ca2+ concentration in (A) WT strips, (B) KI strips. (C) The pCa50 represents the measure of myofilament Ca2+-sensitivity. (D) Delta of pCa50before and after EGCg. (E) nHill coefficient±EGCg. **P < 0.01 and ***P < 0.001 vs. WT in the same condition, unpaired Student's t-test; ##P < 0.001 and ###P < 0.001 vs. baseline, paired Student's t-test, concentration response curves were fitted to the data points and curve comparison was done by using extra sum-of-squares F-test; n = 10; N = 6 mice/genotype.

