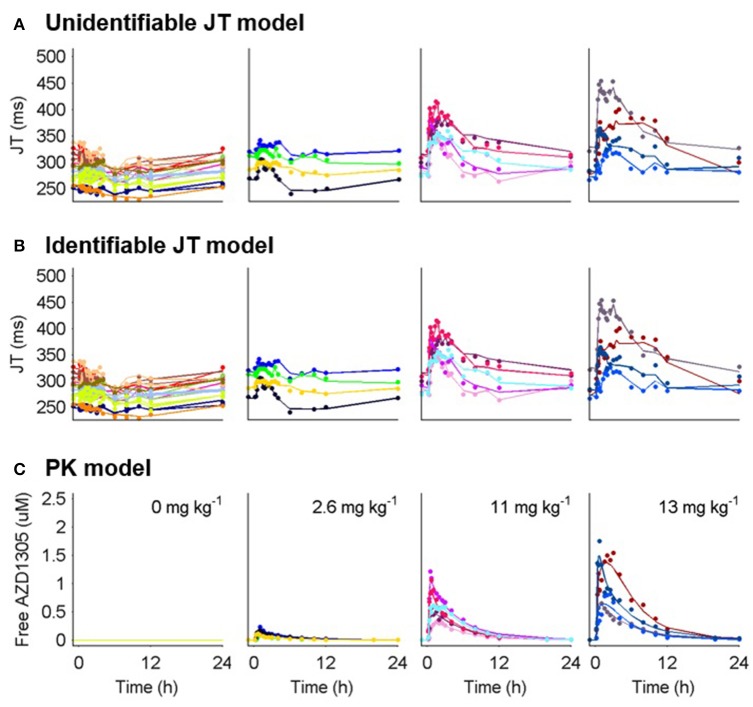
Figure 4.
PK and JT interval data (markers) and model predictions (lines) for humans treated with placebo and 3 selected doses of AZD1305. (A) Model predictions by the unidentifiable JT model. (B) Model predictions by the identifiable JT model. (C) Individual PK model parameters predicting the PK in each subject were used to drive the PD response. Individual subjects are separated by color.

