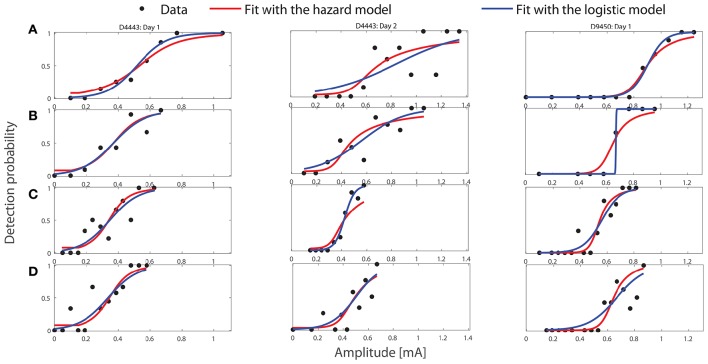
Figure 2.
Fitting performance of the HM and the logistic model with the optimal values of parameters to three representative sets of experimental stimulus-response pairs using TS1, see Table 1. The titles of three columns indicate the subject IDs and the measurement day. Panels (A–D) correspond to the combinations A–D of design TS1 in Table 1.

