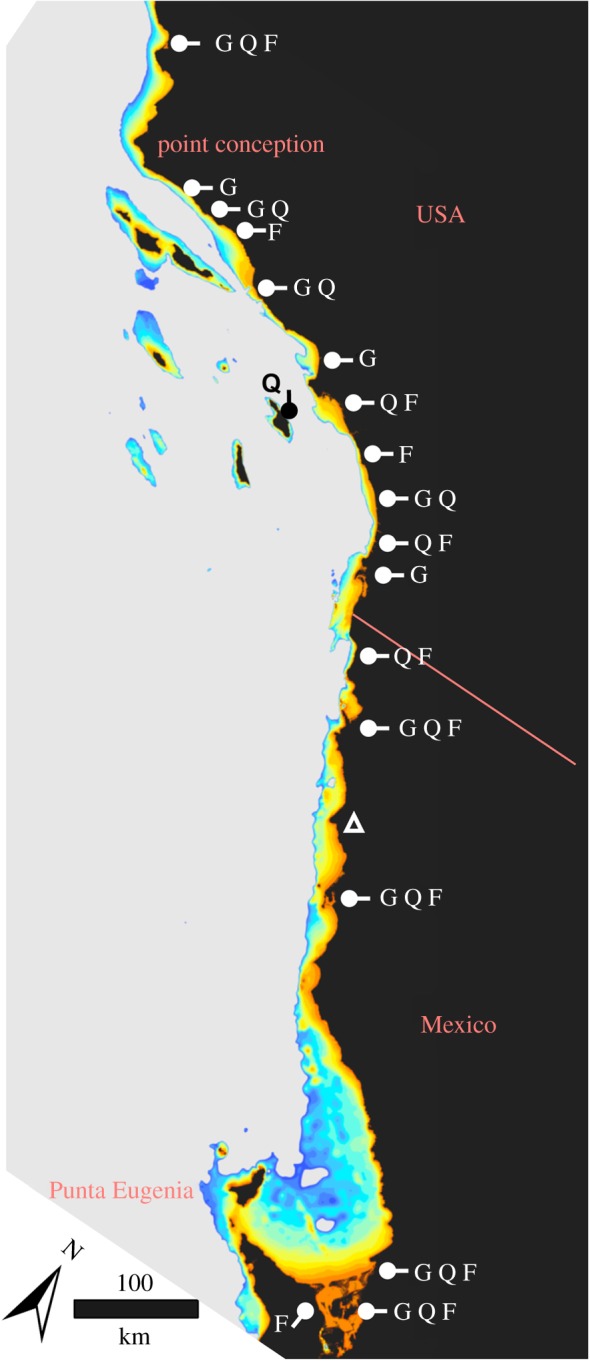
Figure 1.

Sample collection and bathymetric map. Bathymetry is contoured at 10 m intervals from 0 to 140 m below present sea level (orange to dark blue, respectively). White markers note sample sites for fish species where: G, Gillichthys mirabilis; Q, Quietula y-cauda; F, Fundulus parvipinnis. Triangle denotes the Cabo Colonet region, which our models predict supported habitat approximately 10 thousand years ago (kya), but does not today. Note the distribution of offshore islands, whose sizes increased with lowered sea level.
