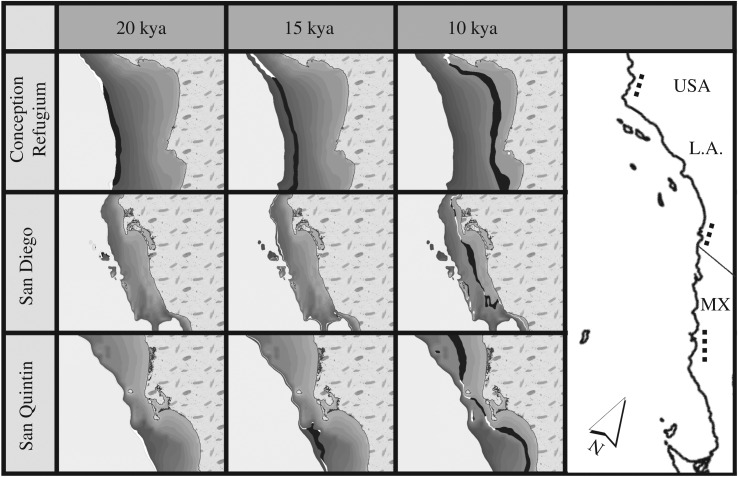
Figure 2.
Estuarine habitat distribution through time. Time slices are shown for three latitude-ordered coastal locations (listed left) that correspond to regions dotted on the guide map (right). Area is coloured as inhabitable (black) or too steep to form habitat (white) at 18–20 kya (140–120 mbpsl), approximately 15 kya (110–100 mbpsl), approximately 10 kya (40–30 mbpsl). Bathymetry is contoured in greyscale by 10 m bins; for each map, white on the left represents water and patterned area on the right represents land. Postglacial habitat originates at different times—North Conception (top) is the only refugium among these three locations (see electronic supplementary material, figure S7 for the full coastline time series).

