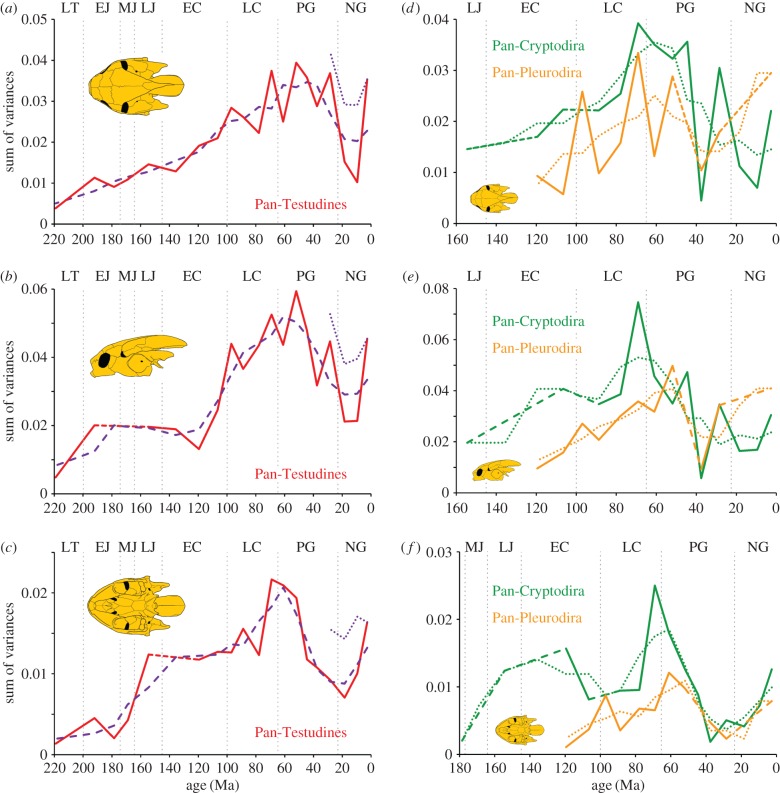
Figure 2.
Temporal disparity of turtle skull shape. (a–c) Sum of variances for all representatives of the turtle stem lineage (Pan-Testudines) in dorsal, lateral and ventral view. The red solid lines illustrate temporal disparity for all time bins, whereas the red dashed lines indicate disparity differences with longer time gaps. The purple dashed lines signify the 3-point average of the disparity curve, whereas the blue-dotted lines show temporal disparity from the Oligocene to Recent after inclusion of a selection of recent taxa with long ghost lineages to these time bins. (d–f) Sum of variances for Pan-Cryptodira (green line) and Pan-Pleurodira (orange line). Dashed lines mark missing time bins owing to small sample sizes. LT, Late Triassic; EJ, Early Jurassic; MJ, Middle Jurassic; LJ, Late Jurassic; EC, Early Cretaceous; LC, Late Cretaceous; PG, Paleogene; NG, Neogene.

