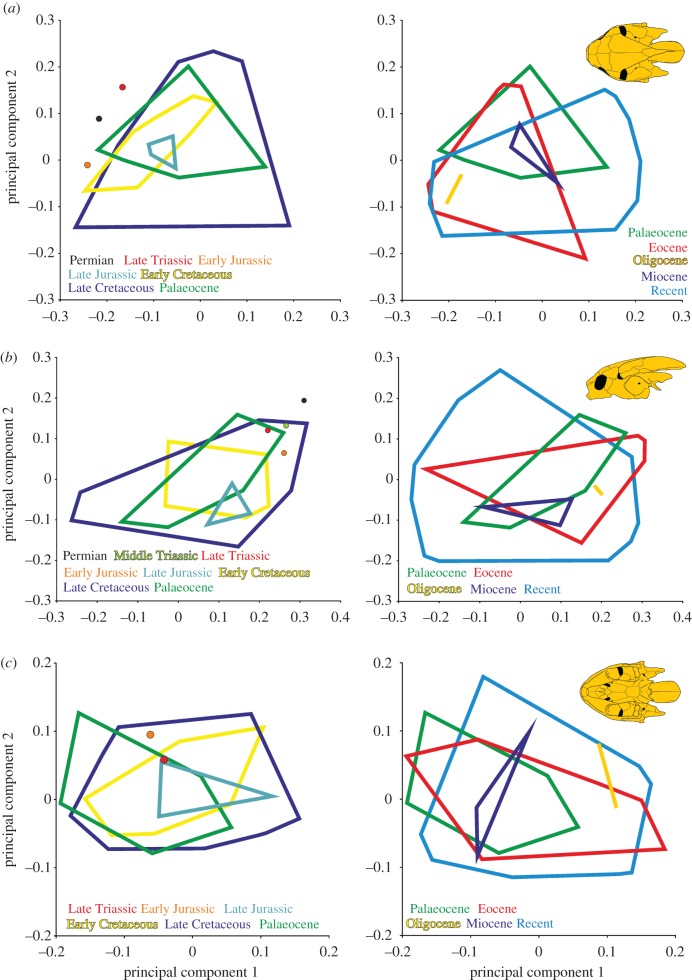
Figure 3.
Two-dimensional morphospace of turtle skulls in (a) dorsal, (b) lateral and (c) ventral view based principal component axes 1 and 2, illustration the size and positional shifts of morphospace for subsequent time bins as coloured outlines. For better overview the diagram was split into two plots, showing changes in morphospace from the Permian to the Palaeocene (left) and from the Palaeocene to the Recent (right). The original scatterplots are provided in the electronic supplementary material, S2, figures S5–S7.

