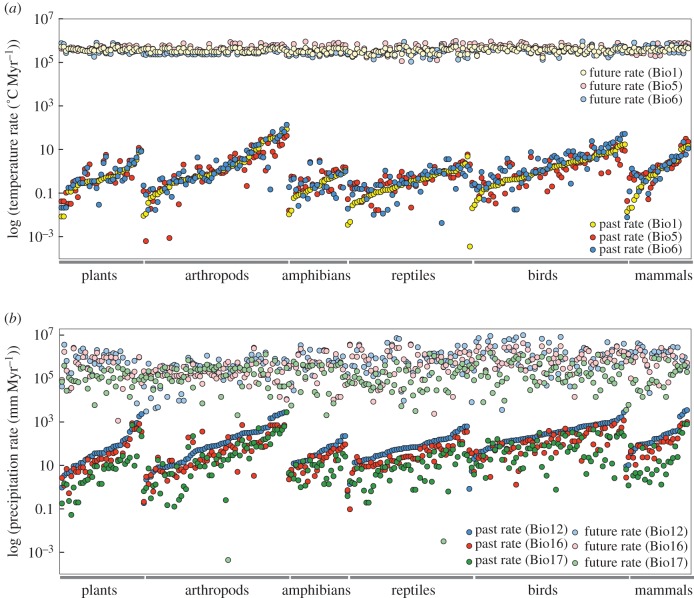
Figure 1.
Comparison of the rate of climatic niche change for 266 phylogroups with the rate of projected future climate change (within their current geographic ranges) based on the AC45 model for (a) three temperature and (b) three precipitation variables. The phylogroups are first sorted based on taxonomic group and then numerically within each group based on values for Bio1 (a) or Bio12 (b). The rates (y-axis) are on a log10 scale. Rates were estimated using the BM model and mean values of climatic niche variables among localities for each phylogroup. Comparison of rates using BM and OU models is presented in electronic supplementary material, appendix S3.

