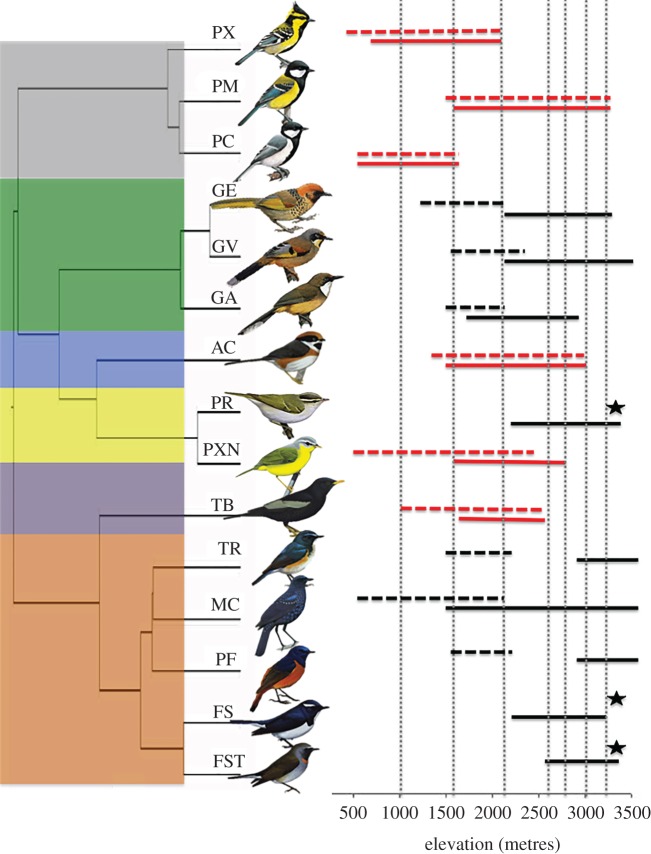
Figure 1.
Evolutionary relationships among species used in the analysis with phylogeny recreated using a posterior set of pruned trees from Jetz et al. [22]. Elevational distributions are from Dixit et al. [18]. Dotted vertical lines represent sampling locations. Horizontal solid lines represent species breeding elevational distribution and dashed lines represent species winter distribution (in metres) of resident (red) and EM (black) species. Stars indicate species with winter distribution outside the study area. Coloured boxes on the left margin denote taxonomic families used in the analysis: grey, Paridae; green, Timalidae; blue, Aegithalidae; yellow, Sylvidae; purple, Turdidae; buff, Muscicapidae. Species codes (from top): PX (Parus xanthogenys), PM (Parus monticolus), PC (Parus cinereus), GE (Garrulax erythrocephalus), GV (Garrulax variegatum), GA (Garrulax albogularis), AC (Aegithalos concinnus), PR (Phylloscopus reguloides), PXN (Phylloscopus xanthoschistos), TB (Turdus boulboul), TR (Tarsiger rufilatus), MC (Myophonus caeruleus), PF (Phoenicurus frontalis), FS (Ficedula superciliaris), FST (Ficedula strophiata). Bird illustrations were reproduced from Handbook of the Birds of the World Alive [23].

