Figure 3.
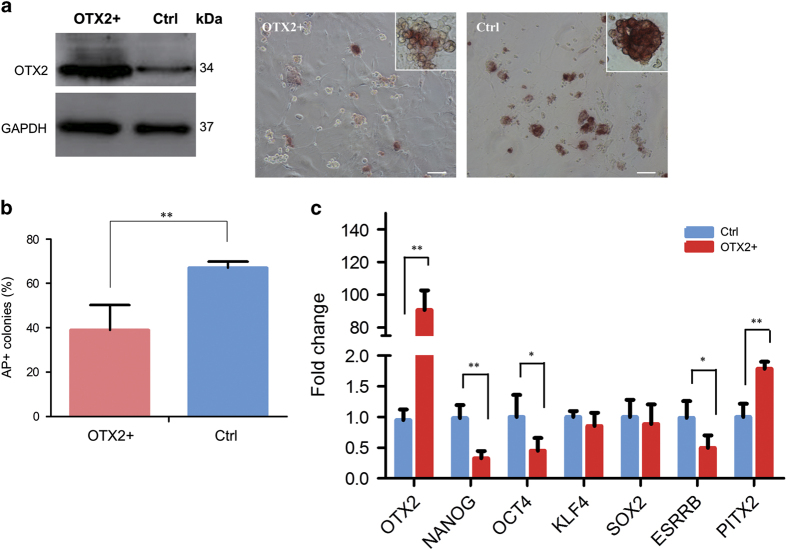
Overexpression of OTX2 in piPSCs. (a) Western blotting analysis of OTX2 protein expression and AP staining in OTX2 transfected PS23 cells. Scale bar, 50 μm. (b) Quantitative analysis of AP-positive colonies. (c) Quantitative RT-PCR analysis of pluripotent gene expressions in PS23 cells. OTX2+, piPS cells were transfected with pcDNA-OTX2; Ctrl, piPS cells without the pcDNA-OTX2 transfection. *P<0.05, **P<0.01, n=3.

