Figure 6.
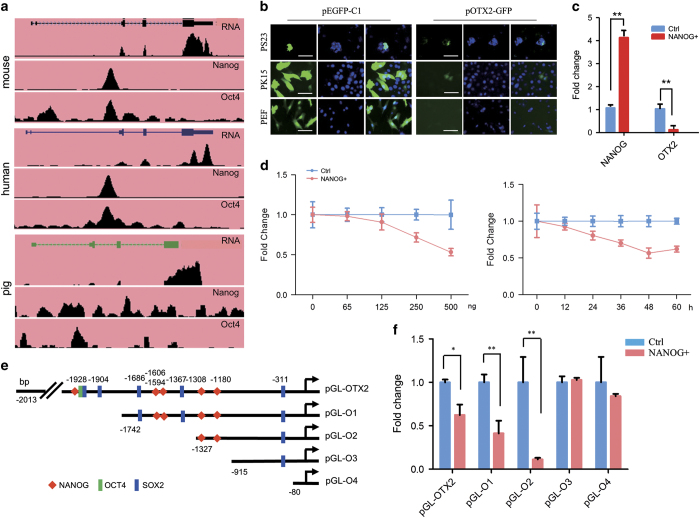
NANOG regulates OTX2 expression. (a) ChIP-seq datasets from mouse, human, and pig show the binding profiles of NANOG and OCT4 associated with the OTX2 promoter loci. (b) GFP fluorescence assay. After 36 h transfection, OTX2-GFP-positive cells were present in PS23 and PK15 cells, but absent in PEF cells. Scale bar, 50 μm. (c) qRT-PCR analysis of NANOG and OTX2 expressions in PS23 cells cotransfected with pcDNA-NANOG. (d) pcDNA-NANOG and pGL-OTX2 were cotransfected into HEK-293 T cells for 36 h. Dose-dependent assay (left) was performed with various concentrations of pcDNA-NANOG. Time-dependent assay (right) was performed with 250 ng of pcDNA-NANOG for various time points. (e) Diagram of reporter constructs with truncated OTX2 promoter. The predicted binding sites of NANOG, OCT4, and SOX2 are denoted. (f) Luciferase assay of OTX2 promoter activity in HEK-293 T cells that were cotransfected with pcDNA-NANOG and a truncated OTX2 vector. Ctrl, cells were transfected only with reporter pGL-OTX2. *P<0.05, **P<0.01, n=3.

