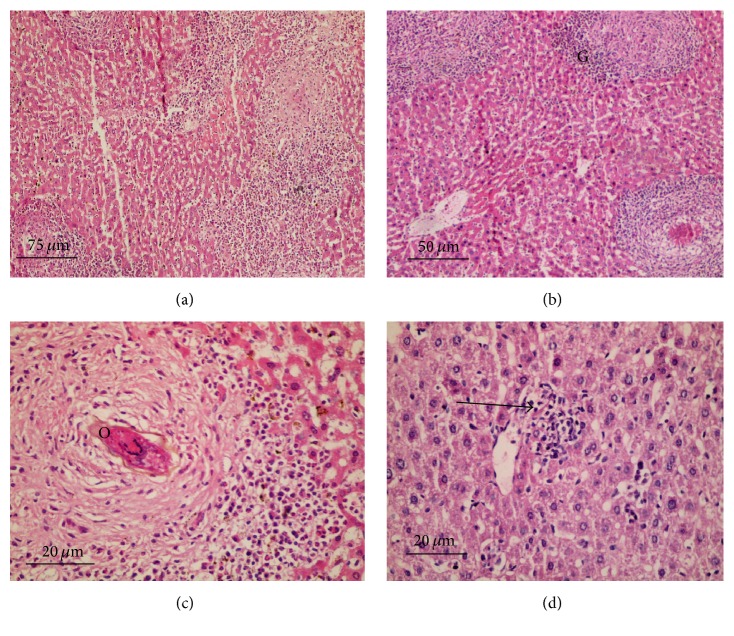
Figure 4.
Histological liver sections; H & E staining; (a) group treated with 800 mg/kg LOP (×100); (b) group treated with 800 mg/kg SOP (×200); (c) group treated with 800 mg/kg SOP higher magnification (×400); all showing less prominent inflammatory reactions; (d) group treated with 800 mg/kg LEP showing moderate diffuse infiltration of liver parenchyma by chronic inflammatory cells without observed eggs or areas of fibrosis (×400); (G) granuloma and (O) bilharzial eggs and arrow pointed to chronic inflammatory cells.

