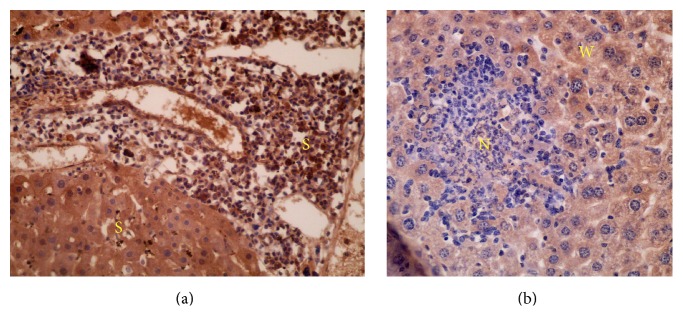
Figure 7.
The distribution and intensity of iNOS in liver sections analyzed by immunohistochemistry; (a) group treated with 800 mg/kg SOP showing strong iNOS reactivity (cytoplasmic expression) in the hepatocytes (×200); (b) groups treated with 600 and 800 mg/kg SEP showing lowest iNOS expression (reactivity) in the hepatocytes (×400); (S) strong, (W) weak, and (N) negative iNOS expression.

