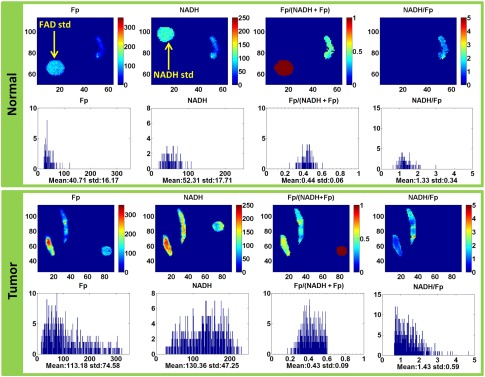
Fig. 1.
The typical redox images and the corresponding histograms of a normal tissue biopsy (image plane ) and a tumor tissue biopsy (image plane ) of the same patient (image matrix , spatial resolution ). The Fp or NADH images show the nominal concentrations in , the Fp redox ratio ranges between 0 and 1. The -axes of the corresponding histograms represent the concentrations or redox ratios. The -axes of the histograms represent the number of pixels in the image plane having a specific value of concentration or the redox ratio. The round spots in the images are corresponding FAD or NADH reference standards.

