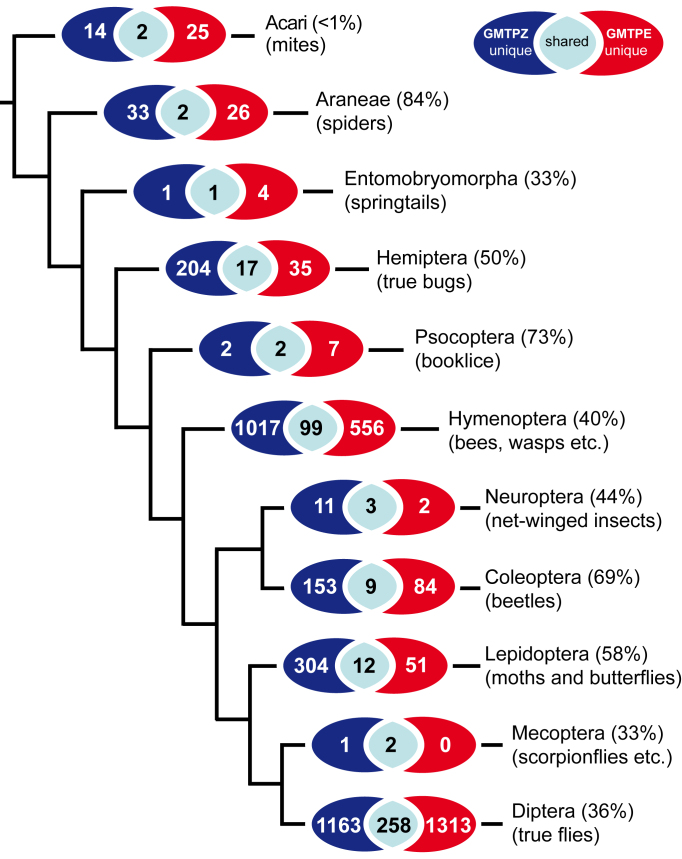
Figure 2.
BIN-overlap between the two sample locations on order level; percentage of BINs identified to genus or species level in parentheses. Tree representing a current estimate of arthropod relationships (from Misof et al. 2014), orders without overlap between the two traps have been omitted.

