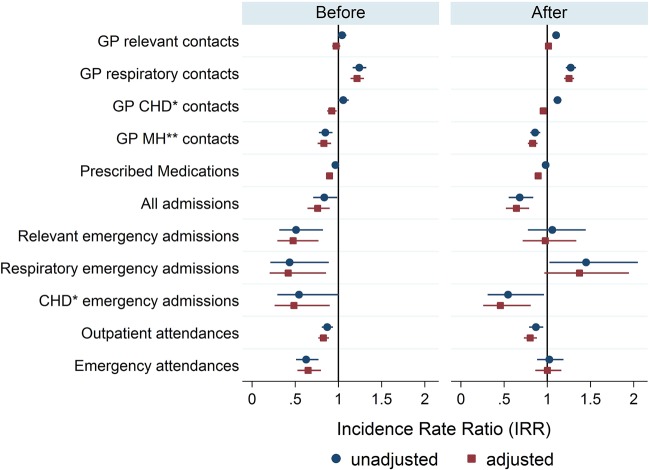
Figure 3.
Differences between groups (unadjusted and adjusted IRR and 95% CIs) for preintervention and postintervention groups. An IRR >1 indicates a higher rate in the intervention group compared with the control group. CHD, coronary heart disease; GP, general practitioner; IRR, incidence rate ratio; MH, mental health.

