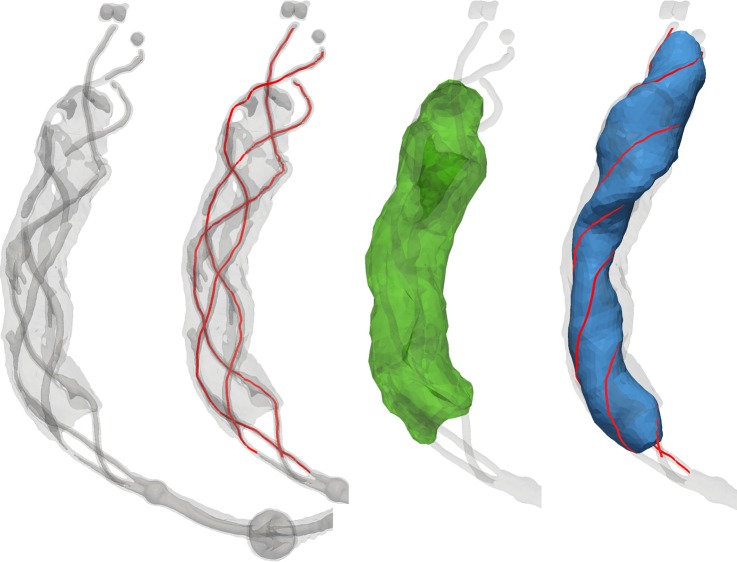
Figure 2.
From left to right: Iso-intensity surfaces representing the device were extracted to guide the identification of individual wires. Seed points were manually placed to extract each of the wires (red). Manual seed points were placed to initialize the level-set segmentation of the clot which, after post-processing, was displayed as a surface model (green). Along consecutive points on the centerline, a Steiner circumellipse was fit to the closest points on the three marker wires (red) to model the interior of the device (blue).

