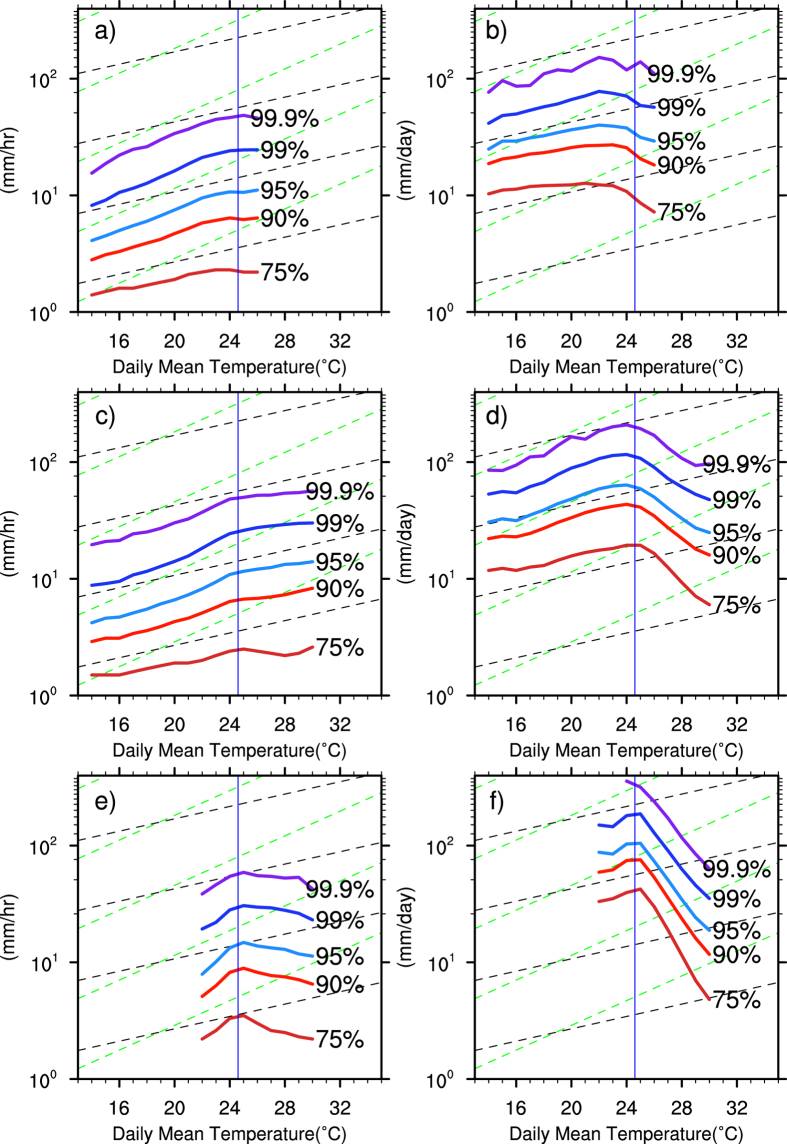
Figure 4.
Regional variation of extreme precipitation scaling with daily mean surface air temperature of the 99.9th, 99th, 95th, 90th and 75th percentiles of hourly (left column) and daily (right) for the three selected sub-regions marked in Fig. 3a): North East (a,b), central China (c,d), South China (e,f). For each region, the data was pooled together before statistics are calculated following the example of ref. 30. The dashed lines (black and green) indicate the C-C and double scalings.

